Please Help!! Enter trade based on line crossing a plotted horizontal line
-
Hi, please i need your help very urgently. I'm creating an EA and im required to enter trades based on the values of horizontal lines on the chart. i've tried achieving this by plotting the objects with the "draw line" blocks, and then i created a variable(double) for the names of the objects and then plugged in the variables in the space given for the names or prefixes of the objects in the draw line block. Finally, i then used the condition block and created the condition that then results into a buy or sell action if the candle1 high or low is higher or lower than the horizontal lines. This is what i did and when i tested the EA on mt4, it plotted the lines but did not enter the trades when the candle highs and lows crossed the horizontal lines. Please help. I just need to be able to enter trades based on the objects placed on the chart. thank you
-
@ewole Hello,
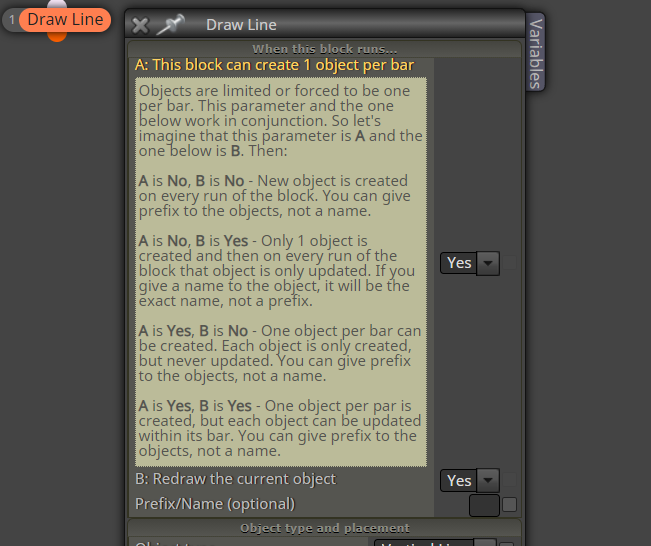
Depends on the options you choose but sometimes you need to have a name and at times it's a prefix. so the variable can be either double or string. If you share the work it would be easier to see where the error is.
-
Hi and thank you so much for your reply. i will attach the link to the project below so you can check it out. i want to enter a buy trade when the price hits the lower horizontal line and a sell position when it hits the upper horizontal line. the link is below:
https://fxdreema.com/shared/9PtBT5Tfd
Thanks so much and i hope to hear from you soon. -
There is something that I don't understand. Why did you place a variable in the prefix/name? This looks correct except that there is nothing that shows what changes the variable names. Did you think that by placing the variable in the draw line block, the EA will save the name in the variable?
-
@q8carpenter Yes I placed a name in the prefix name so that the price value of the horizontal line is is gotten and put as the value of the variable.
-
@q8carpenter Please how do I get the value of the line so i can use it to enter trades and place stoplosses? i also want to be able to do same for the fibonacci retracement levels so i can be able to use the values of the levels to enter trades and place stops. thanks
-
@ewole This is not gonna work this way as this is not the way to extract the prefix or name.
How many lines where you expecting to have on the chart at once?
-
@q8carpenter I was expecting to have two horizontal lines draw in lets say a 4 hours period so im buying when it touches the lower line and selling when it touches the upper line. thanks
-
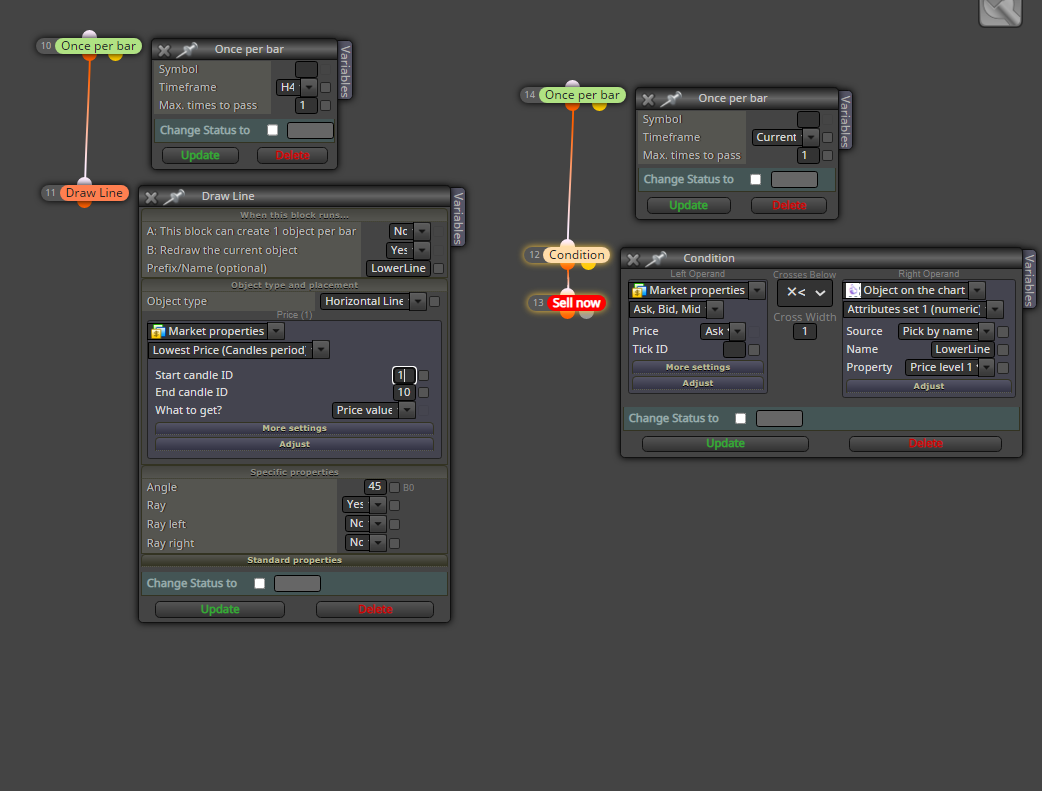
Ok So will the strategy be something like this?:
- draw a line at the high of the past 10 bars and a line at the low of the last 10 bars on the current time frame.
- re draw these lines every 4 hours
- buy and sell when the lines are crossed
-
@q8carpenter Yes exactly! Just something as simple as this. Please how can i achieve this? If possible, you can just create a simple project and share with me so i can study the blocks myself. thanks
-
-
@q8carpenter Thank you So SO much! I really appreciate you!