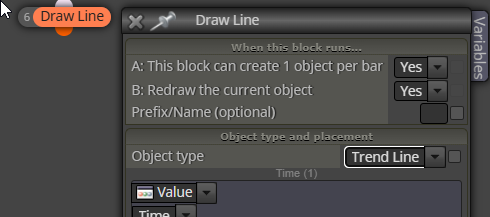
thanks, How to draw trend lines?
-
Re: how to make formula with multiple indicators?

again, thanks very much for your precise demonstration. i have written something accordingly.
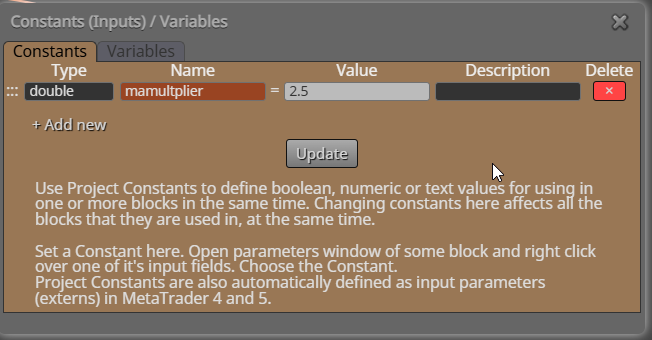
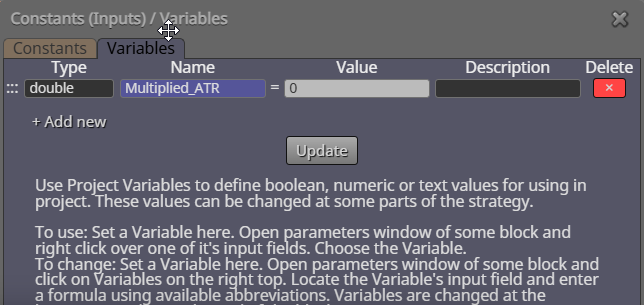
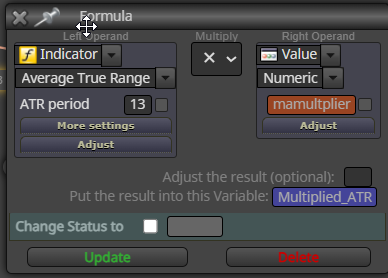
https://fxdreema.com/shared/Dn3o3W6zcwhen price > MA+(ATRx2), buy;
when price < MA -(ATRx2), sell;
"2"is just a random multiplier and can be changed according to different situation. whereas MA+(ATRx2) and MA -(ATRx2) performs as the upper & lower lines that similar to a channel.however, i would love to draw them on the chart so i could see how they interact with each other.
but the lines i have drawn are obviously wrong. is there any suitable blocks i can use so it would appears more like a typical trend line? many thanks! -
Create as pictures and draw a trend line rather than a channel