Hello Miro
Awesome ") I'll look into the math ASAP
I'll look into the math ASAP
Best regards /danerius
Hello Miro
Awesome I'll look into the math ASAP
Best regards /danerius
Hello Miro and many thanks
I think there might be an error. Ive pre-tested this idea on XAGUSD in Excel and it behaves differently. Ive included a screendump where the values are ”200 / HighLowValue ^ 3500.
Theses numbers are gonna vary between FX Pairs and Time Frames. But this could be a good start
I can send you the Excel fille if it helps?
Best regards /danerius
Hi
If someone could help me with code for this it would be great. Ive included the code that Miro helped me with earlier.
The concept is that this indicator is going to adjust to price fluctuations and in turn control other indicators.
The idea is to:
If anything is unclear. Please feel free to ask
Many, many thanks /danerius
//---
int i;
for(i=barsToCalculate();i>=0;i--)
{
double priceHigh = iHigh(Symbol(), Period(), i);
double priceLow = iLow(Symbol(), Period(), i);
double lowHigh;
  if(priceHigh != 0)
  {
     lowHigh = priceLow / priceHigh;
     Buffer0[i] = MathPow(lowHigh, 100);
  }
  else
  {
     Buffer0[i] = 0;
  }
}
for(i=barsToCalculate2();i>=0;i--)
{
Buffer1[i] = iMAOnArray(Buffer0, 0, maPeriod, 0, (ENUM_MA_METHOD)maMode, i);
}
//--- return value of prev_calculated for next call
return(rates_total);
}
//+------------------------------------------------------------------+
Hello Miro
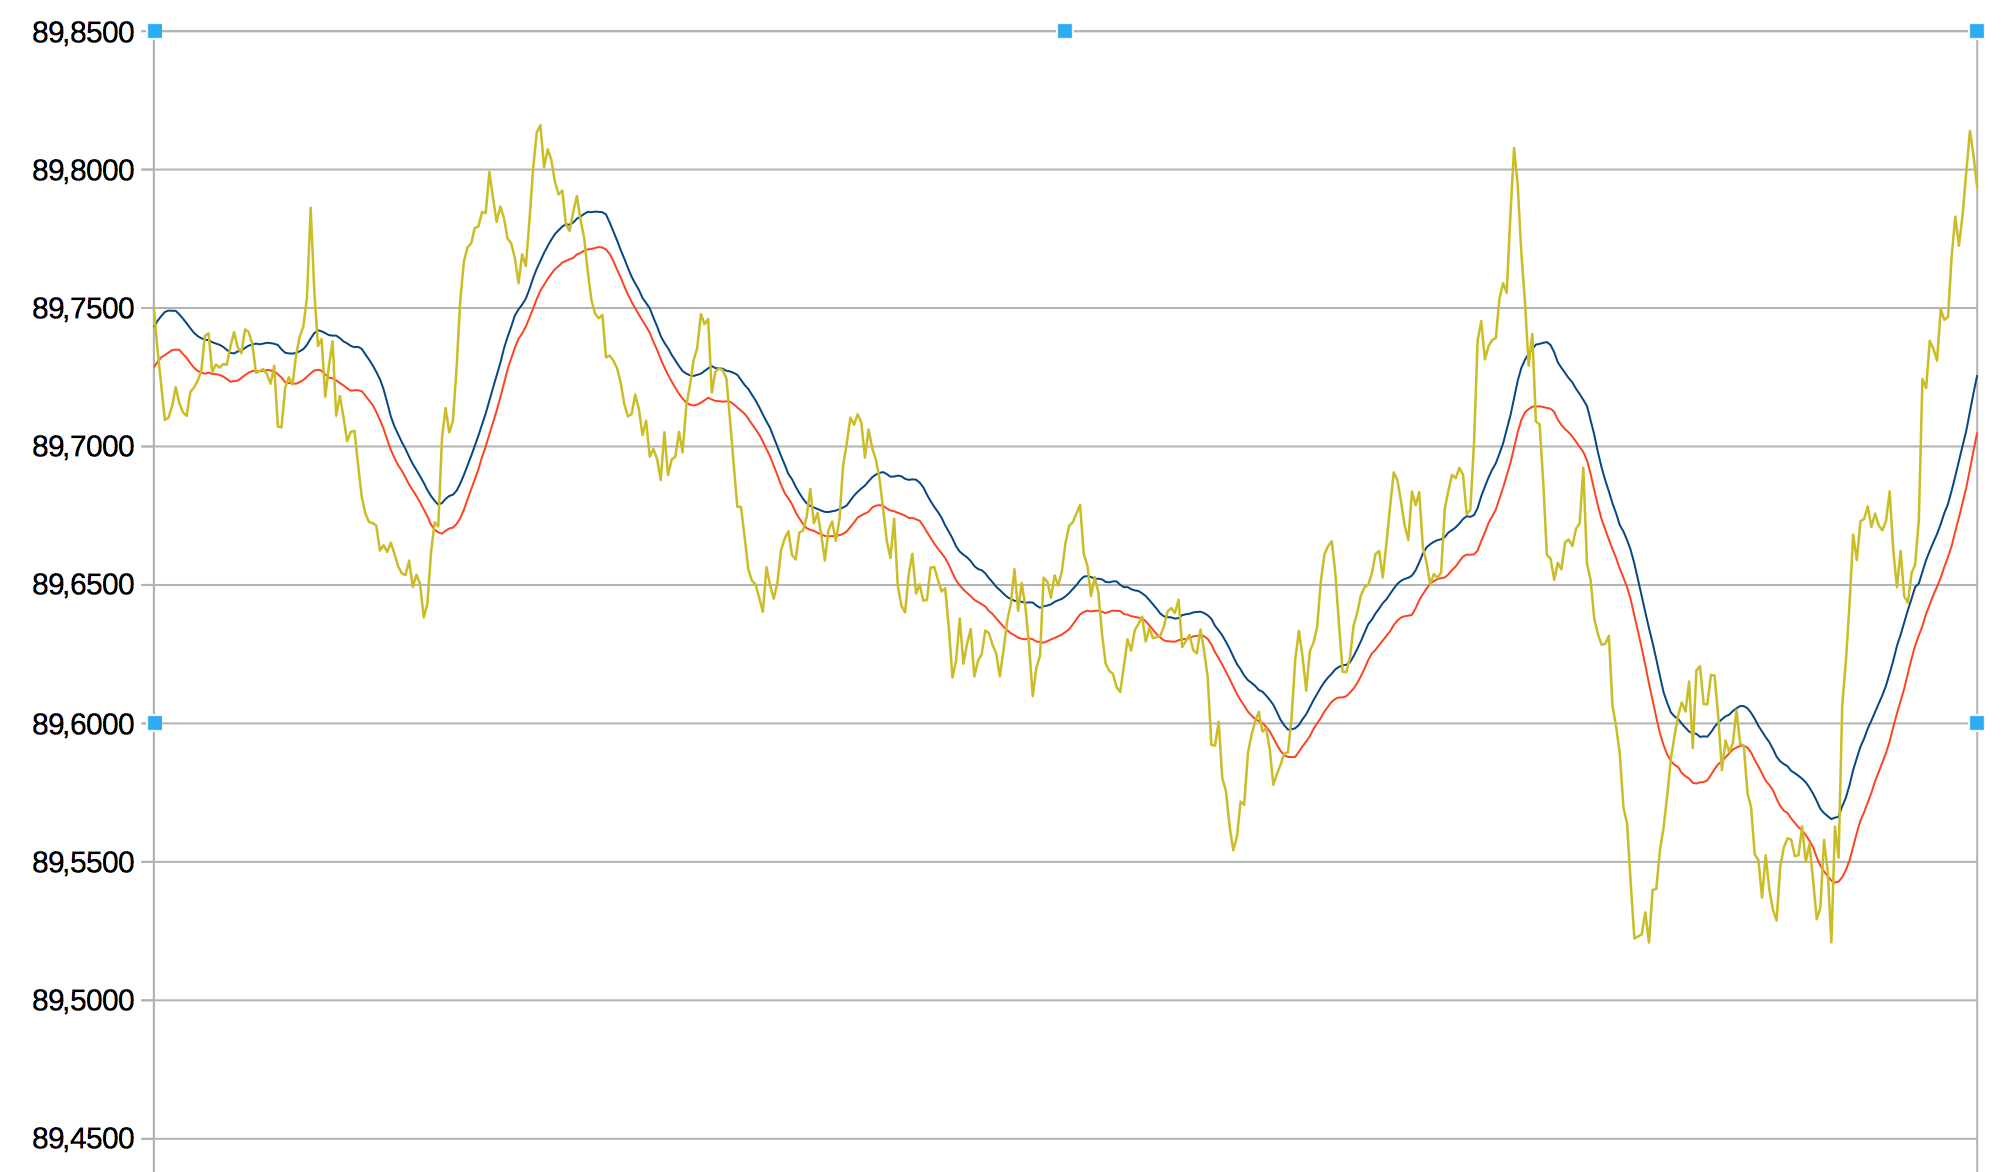
Im considering adding a Simple Moving Average to the same window. Im guessing this is the code for the existing Weighted one?
Buffer1[i] = iMAOnArray(Buffer0, 0, maPeriod, 0, (ENUM_MA_METHOD)maMode, i);
How would I modify it for A Simple MA? Also? Im presuming that I need to change other code as well? ”plot buffer”....?
Thanks and regards /Bo
Awesome. Thanks Miro
I got it to work as intended.
Not quite as I expected but thats why Im testing things
Back to the drawing board
/Bo
Hello Miro
In Excel - it would look like this. =((A/B)/C)*100
And then a Weighted Average on that sum
Thanks /Bo
Hello Miro
This formula didnt go fully to plan. It only worked at the 1 Minute Time Frame. So it needs some additions. I thought Id start with making a High/Low Percentage to Close Price. So essentially High divided by Low. Then the sum of that divided by Close. And then times 100 for a percentage sum.
What do I need to add to make a formula lie that work?
Thanks /Bo
int i;
for(i=barsToCalculate();i>=0;i--)
{
double priceHigh = iHigh(Symbol(), Period(), i);
double priceLow = iLow(Symbol(), Period(), i);
double lowHigh;
  if(priceHigh != 0)
  {
     lowHigh = priceLow / priceHigh;
     Buffer0[i] = MathPow(lowHigh, 20);
  }
  else
  {
     Buffer0[i] = 0;
  }
}
for(i=barsToCalculate2();i>=0;i--)
{
Buffer1[i] = iMAOnArray(Buffer0, 0, maPeriod, 0, (ENUM_MA_METHOD)maMode, i);
}
Awesome Miro
Thanks a million for this. Im hard at work on this now
Regards /Bo
Excellent and a big thanks for the code. From what little coding I know - 9t looks really elegant
This High/Low comparison is the first block of a four part thing.
Second part is an Weighted Average of the High/Low results. Third part is a formula for adapting the results to control other indicators. And lastly hooking that up that to the indicators and test wether its working as I intended
Can I use the regular WMA code with your code?
Regards /Bo
Duuude... Thats brilliant
How did you do that?
/Regards
Thanks Miro
I understand what youre saying. But I have a slightly different end goal in mind. Im looking to produce a curve that has a high value at consolidation. And a low for the opposite. And then base an EA on that
The Bollinger Bands are derived from a Close Price Standard Deviation and values can vary a lot. Whereas comparing High and Low Prices seems to be a bit more stable and better for what I had in mind
Regards /Bo
Hi. Awesome. Thanks so much
This is the first part of a strategy/indicator. Theres is one more formula but I thought Id start with this
The idea is to indicate when there is market is in consolidation. I figured the proportion in Low/High Price would be a good way
How do I get this in a separate indicator window?
Regards /Bo
Hi
So Ive come to realise I need to baby step my way in to fxdreeam and ask for help every step of the way. Ive tested a strategy in Open Office and would like to make an EA
First of all. It divides Low price by the High Price and then takes that to the power of 20
How would I go about doing that?
Thanks and regards /Bo
Hi and thanks for your reply
How would I go about posting a logic block?
Also. I tried different setups and double checked with MetaTrader. It was one particular setting that was very off. Whereas most of time it was okay
/Regards
Hi guys and Happy Easter
Ive done some various testing recently with the Buy-Sell-Buy-Sell Strategy and it works fine as is. As soon as change the settings it starts behaving erratically
Anyone else experiencing this? Any tips or solutions?
Thanks
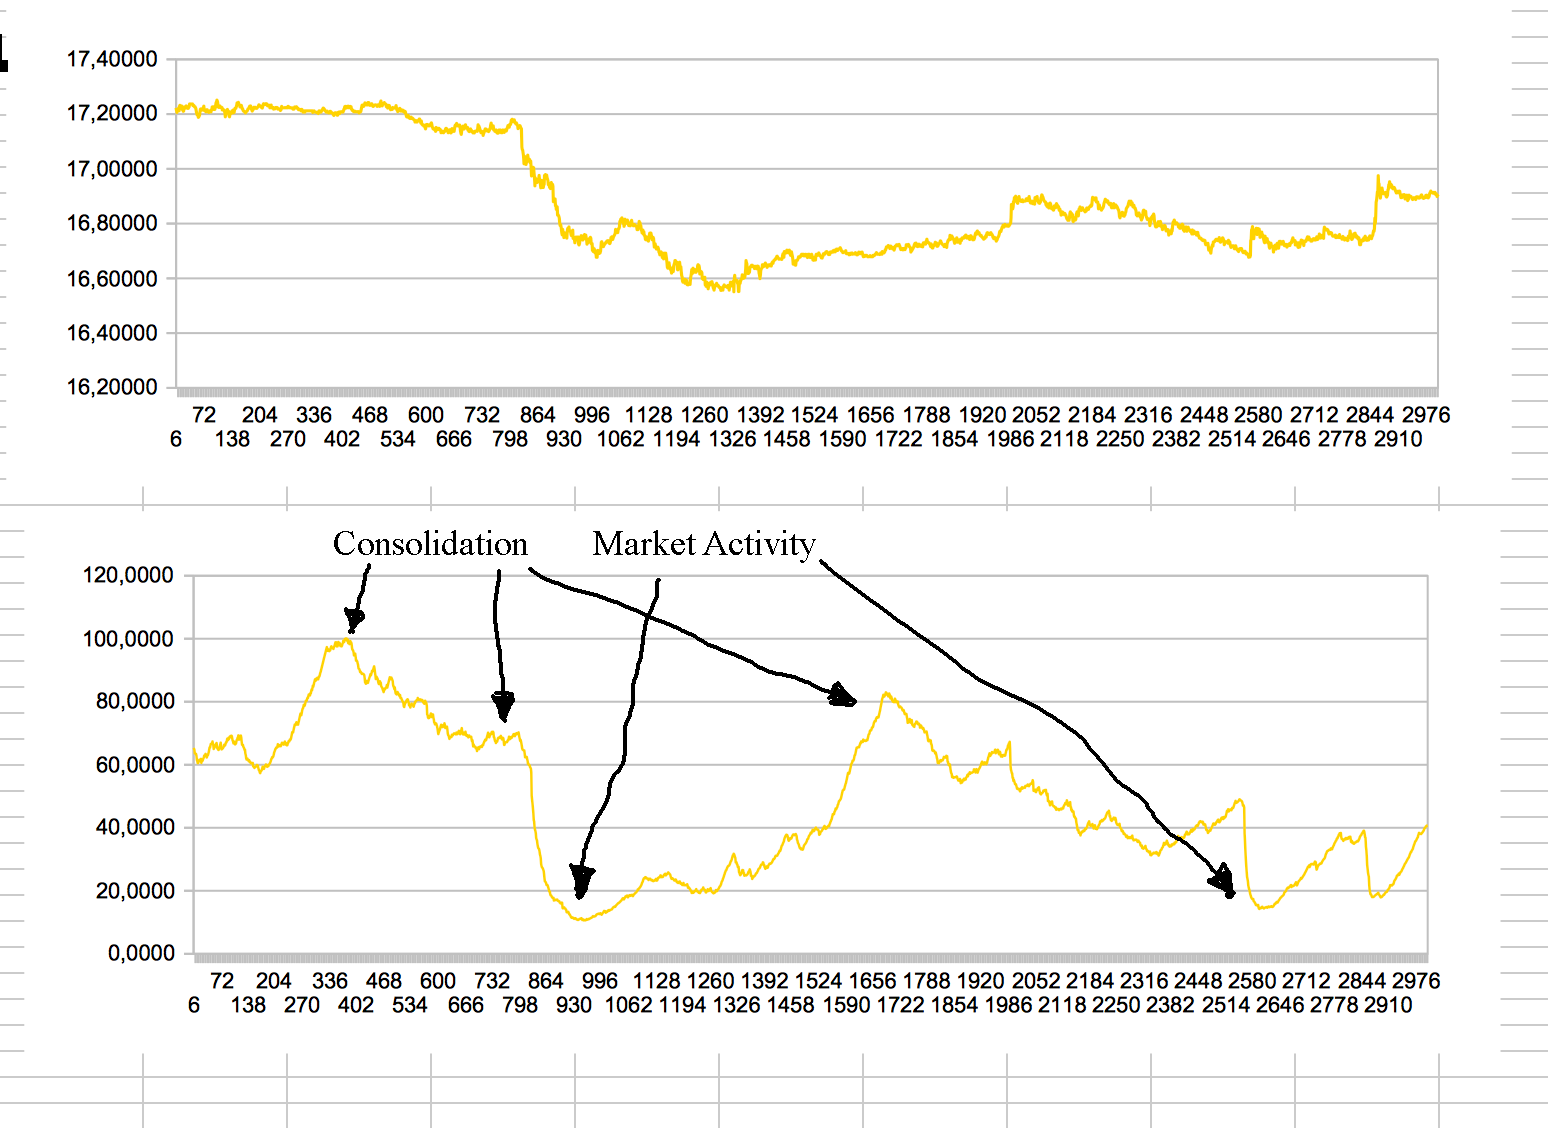
Hi. Ive been doodling with market data in Excel and came up with this. The idea is to produce a filter for market noise and have an indicator line working from that. Ive omitted the Close Price cause it made the graph a bit hard to read. But it roughly follows the two black lines.
So sell is when the orange line crosses below the lower black line. Buy is when it crosses over the upper line. Close is when Buy/Sell crosses the black line again.
What do you guys think? Could this work as an EA?
/Thanks + Regards
Thanks Radoslav
I managed to run the EA now with only one error message. As opposed to 15 errors + 5 warnings 
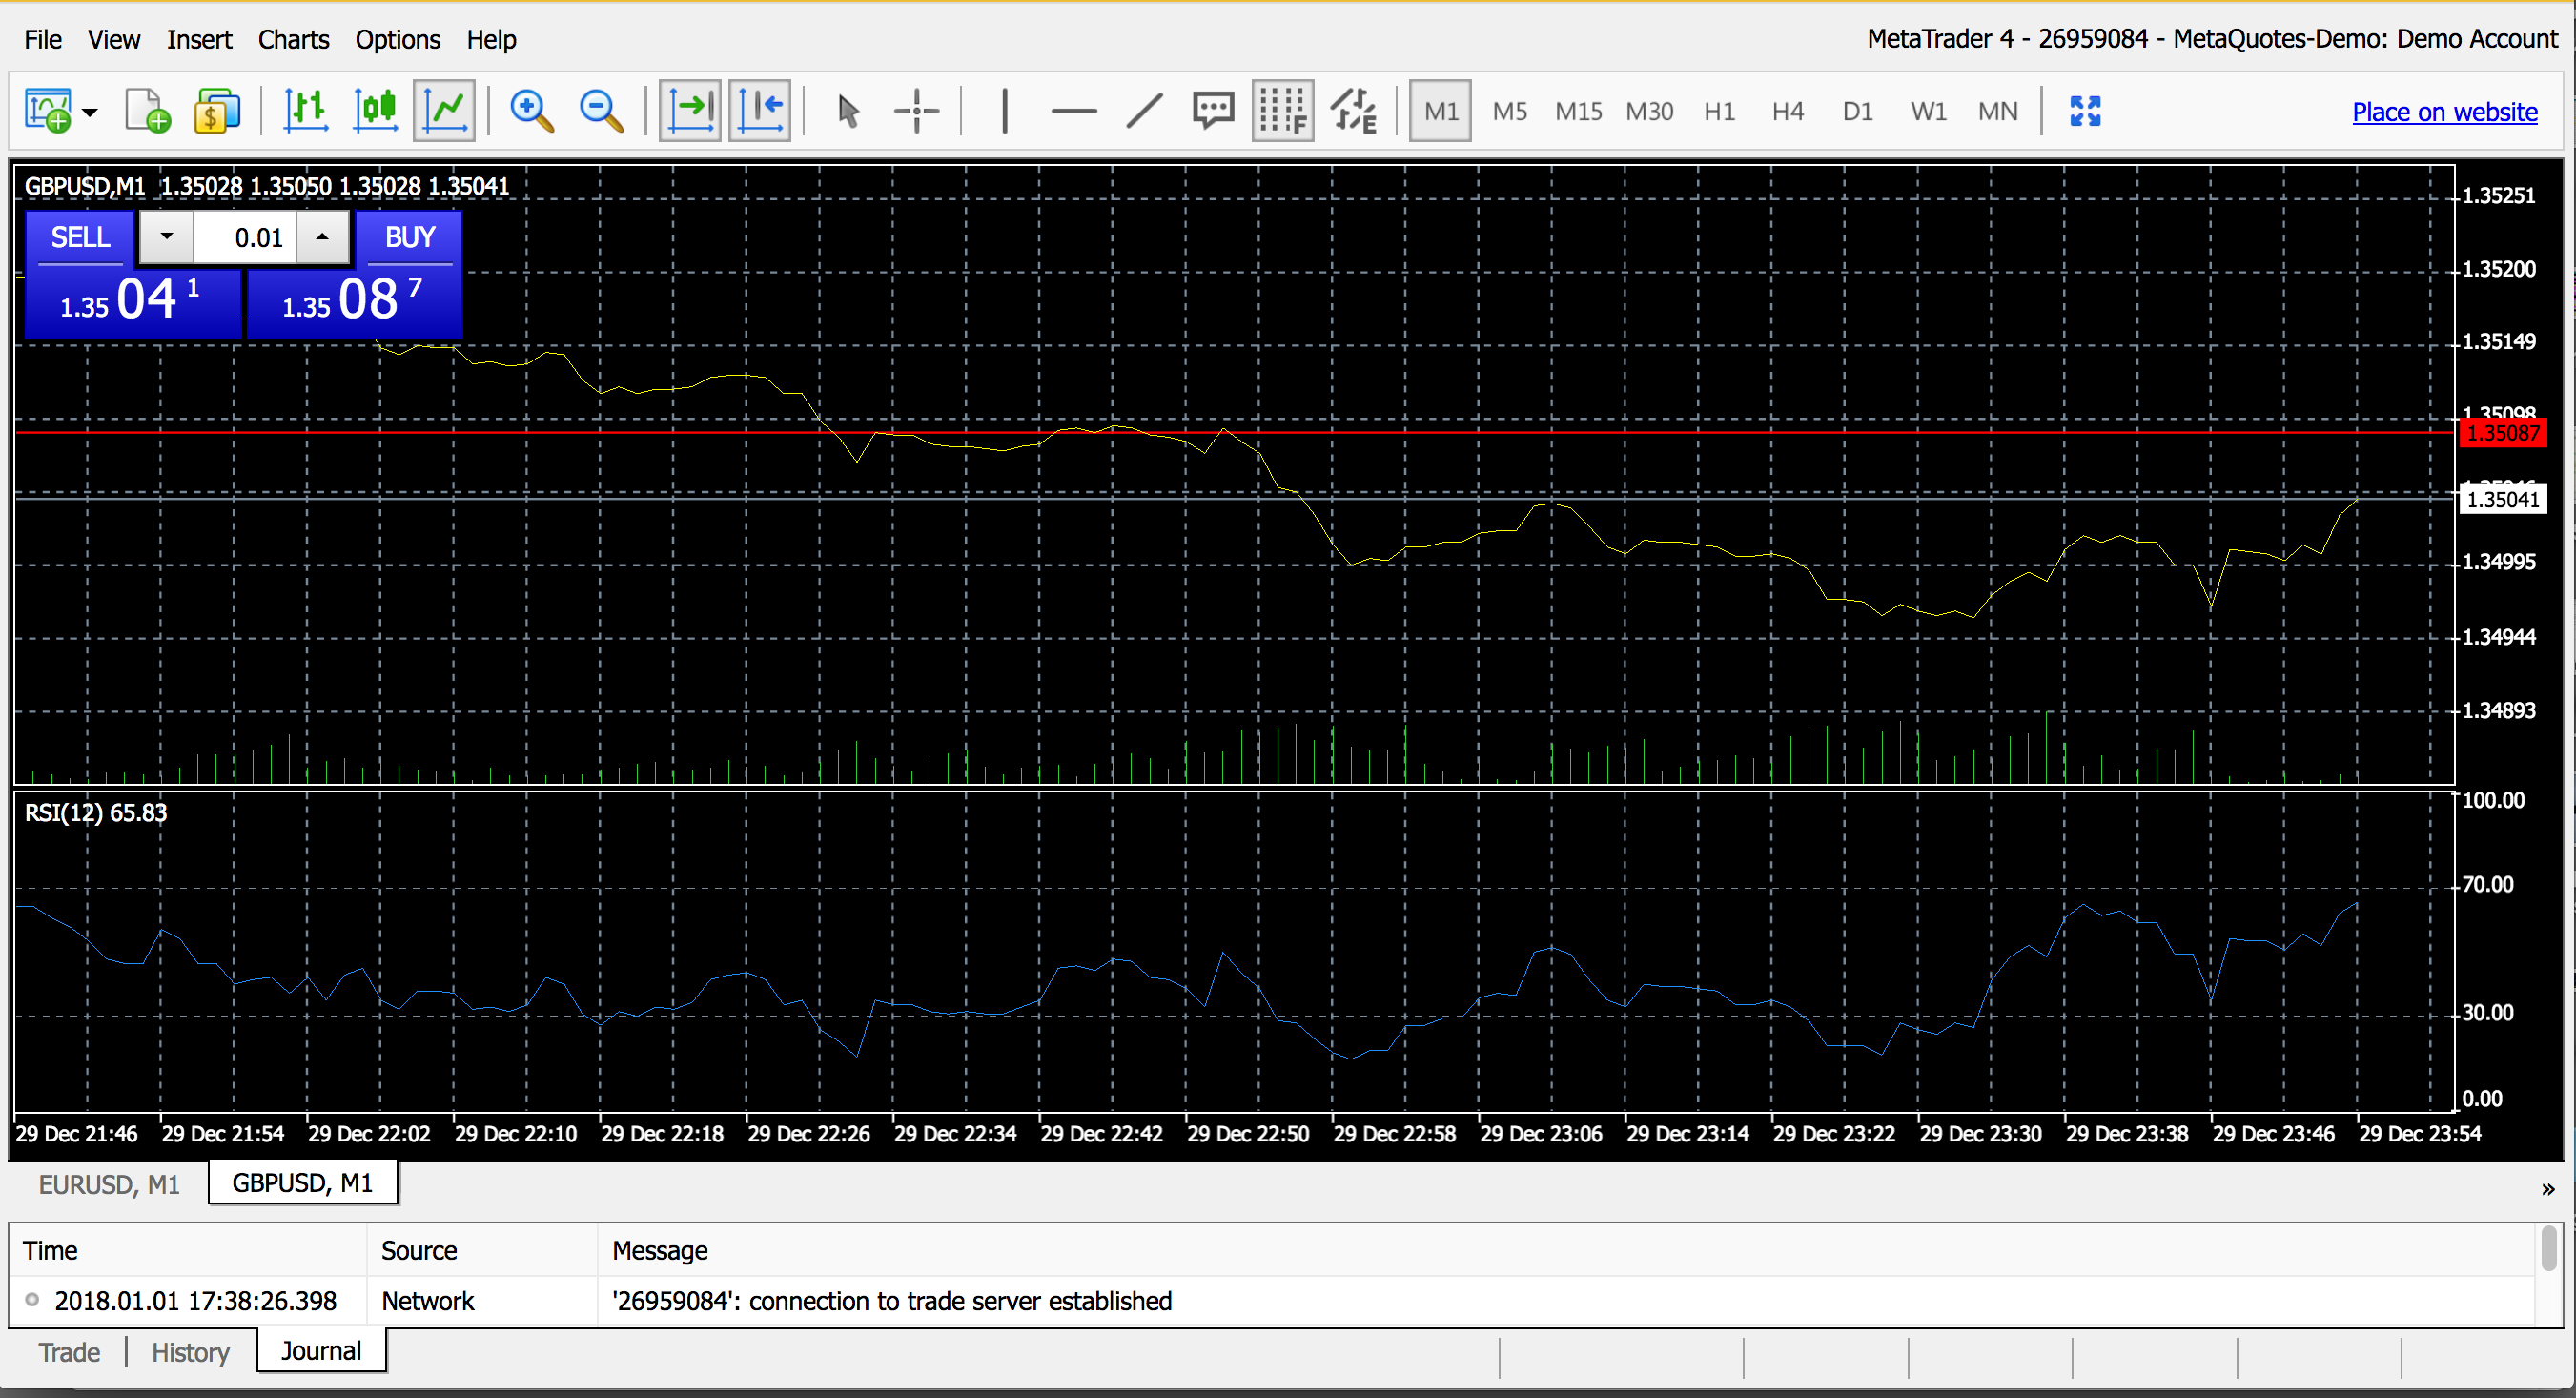
Wich one of the blocks should i use to get the results in a separate window? Like the RSI in the example below?
Regards /Bo