i wil try this and return here.
F
Posts made by fabiobioware
-
RE: Stop the EA when positions are in progress and Start again after closed position.posted in Questions & Answers
-
RE: Stop the EA when positions are in progress and Start again after closed position.posted in Questions & Answers
it didn't work, I had to use it as follows.

-
RE: Stop the EA when positions are in progress and Start again after closed position.posted in Questions & Answers
@ambrogio which block did you use for "buy position closed" ?
-
RE: Stop the EA when positions are in progress and Start again after closed position.posted in Questions & Answers
which block did you use for "buy position closed"
-
RE: Stop the EA when positions are in progress and Start again after closed position.posted in Questions & Answers
https://fxdreema.com/shared/Dh2d8RpUb i create this, but
what is complicated is to identify the following.
When buying or selling immediately block.
When the purchase or sale is completed, activate the blocks again. -
Stop the EA when positions are in progress and Start again after closed position.posted in Questions & Answers
Hello, I would like to block the operation of some blocks when the EA opens a buy or sell order.
These blocks must be rehabilitated after the negotiation in progress is closed, whether it has touched take profit or stop loss.Can someone give me an example of how to do this?
-
RE: How to use this block? NEW TOP and NEW BOTTOM in trend.posted in Questions & Answers
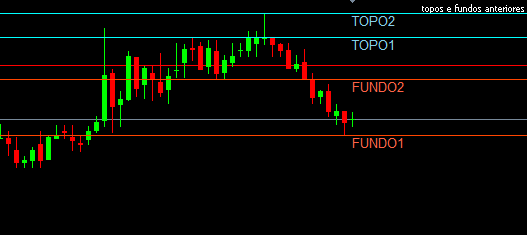
there was a change here, before it was up and now down.
-
RE: How to use this block? NEW TOP and NEW BOTTOM in trend.posted in Questions & Answers
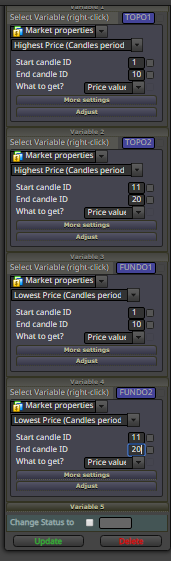
WHEN THESE LINES ARE ALIGNED:
TOP1
TOP2
BACKGROUND1
BACKGROUND2this represents a sequence of what I said, top higher than the previous top and bottom higher than the previous bottom, indicating a possible upward trend at the moment.
It is configured the period of verification of candles from 1 to 10 for tops and bottoms 1
The candles verification period from 11 to 20 for tops and bottoms 2 is configured -
RE: How to use this block? NEW TOP and NEW BOTTOM in trend.posted in Questions & Answers
https://fxdreema.com/shared/MJQgjZ9xe MY PROJETCT FOR THIS.
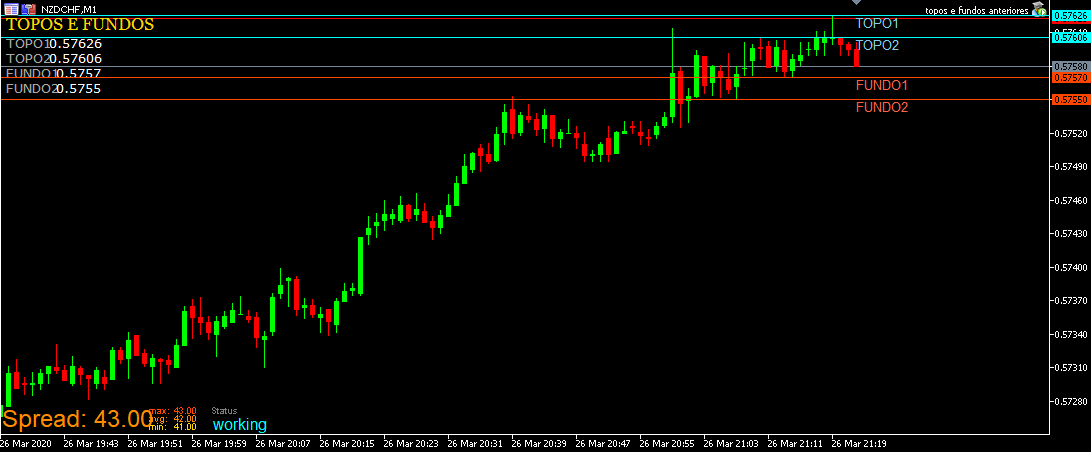
just for language reasons.
(TOP = TOP)
(FUNDO = BOTTOM)see how was my project.https://fxdreema.com/shared/kCZxSkM2
-
RE: How to use this block? NEW TOP and NEW BOTTOM in trend.posted in Questions & Answers
@l-andorrà said in How to use this block? NEW TOP and NEW BOTTOM in trend.:
That is a complex group of conditions for the EA to identify. I don't think those blocks can do what you want. You will need at lest one independent tree of blocks just to identify that structure. It is not as simple as a single block can do, I'm afraid.
I agree, I am trying for example to create a sequence of conditions for this pattern to be interpreted as an upward trend.
I don't know how to make fxdreema understand the following, for example:
Check within 30 past candles
Identify 2 tops in these 30 past candles
Identify 2 funds 30 past candlesConfirm that: The last top is higher than the second top.
Confirm that: The last feature is higher than the bottom penultimate.Is it possible to do something like this? Do you have an example of how to do it?
-
RE: How to use this block? NEW TOP and NEW BOTTOM in trend.posted in Questions & Answers
@q8carpenter said in How to use this block? NEW TOP and NEW BOTTOM in trend.:
first you need to know what conditions do you consider a trend and what do "you" exactly want the EA to do before choosing the block. Other than that, the block explains itself. If you click on the options like "min pips range..." or "trend quality...." you'll get a detailed explanation of what it exactly does.
The reason you need to think about what you want it to do first before choosing the block, is because you may have other options like using and MA indicator as a trend filter or zigzag and so on...Hello, I consider an upward trend formation when I identify a pattern of:
higher tops and higher bottoms
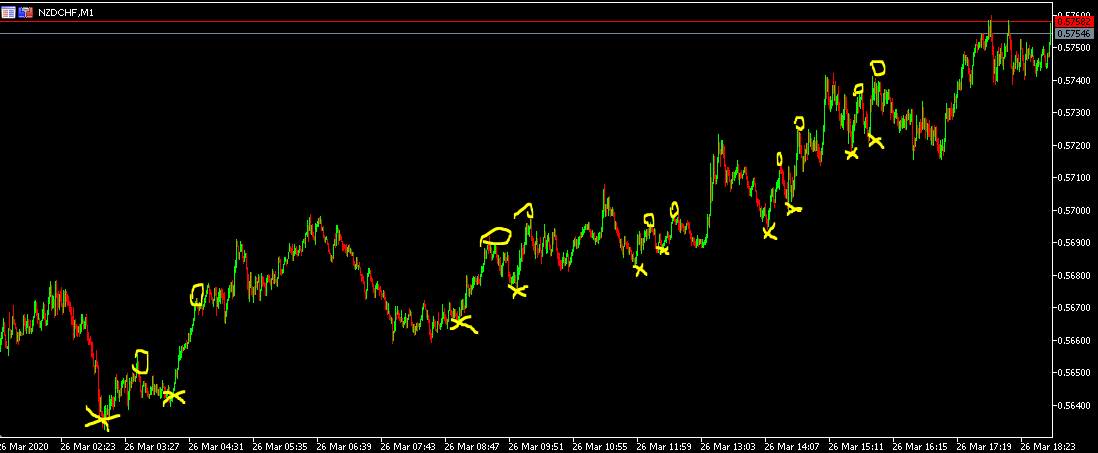
for example see in the image below the NZDCHF asset in M1
(X) shows the bottoms and (O) shows the tops.
Note that a bottom is made with (X) and a top is made with (O) soon after it is detected an (X) higher than the previous one and an (O) higher than the previous one, this in my understanding already means a confirmation trend.How could I fit this into my EA?
An example that I wanted to give is the following regardless of the EA rule for buying and selling.When a condition similar to this was detected in the image, the sales block would be disabled.
-
How to use this block? NEW TOP and NEW BOTTOM in trend.posted in Questions & Answers
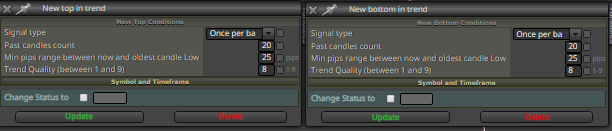
Can anyone explain with images how to correctly use this block to detect an upward trend or a downward trend?
Basically I want to place a condition directing my Ea to release purchases or sales only if these blocks allow it. -
RE: Trailing stop, activate when target price is reached.posted in Questions & Answers
@l-andorrà said in Trailing stop, activate when target price is reached.:
You can do it this way:
too bad, this option does not exist for metatrader 5
-
Trailing stop, activate when target price is reached.posted in Questions & Answers
I would like to know how to make the trailing stop activated only when it touches a specific target price, as shown in the image:
- If a purchase occurs on the blue line at 1.08000 the trailing stop should be activated only when it hits the price 1.08803 and drag the Stoploss to the price 1.08401
If anyone can put examples with images or share projects for me to be able to do I would be very grateful.

-
RE: Mark with numbers the previous tops and bottoms on the graph ???posted in Questions & Answers
@l-andorrà said in Mark with numbers the previous tops and bottoms on the graph ???:
Are those numbers supposed to be over/above a specific candle? According to your screenshot, numbers 1 and 2 are on max/min of zigzag legs. They will change over time. Maybe you can identify those legs and then write the number there
Yes,
Even numbers above the candle that formed the new top.
Odd numbers below the candle that formed a new fund. -
RE: Mark with numbers the previous tops and bottoms on the graph ???posted in Questions & Answers
@l-andorrà @miro1360, @trader-philipps
Hi friends, I managed to put the text at the height I need and make it follow the line, but now as shown in the image I want this text to be on top of the line above the candle that corresponds to MAXIMA.
The same thing I want to do for the bottom, put the writing under the candle. How do I do this? -
RE: Mark with numbers the previous tops and bottoms on the graph ???posted in Questions & Answers
The BLUE line is my variable defined as "MAXIMA" it is adjusted whenever a candle breaks its value, so when a candle breaks it will adjust itself forming a new maximum, if the candle just touches it without pushing it remains in the price .
When a candle touches and pushes it will form a new maximum, when the candle finishes pushing this line and does not push anymore I want a number to be placed on top of it naming it. -
RE: Mark with numbers the previous tops and bottoms on the graph ???posted in Questions & Answers
@l-andorrà but, where am I going to put the sequence of numbers? I saw that it is a block of text, but if I configure exactly the way you said I will have nowhere to write the number, in reality I want that whenever a new top is identified an even number is placed on top of the candle that formed the top.
If a new fund is identified, an odd number is placed below the candle that formed the fund.
 for example.