Miro1360 you are a GENIUS ! It works, EA is now working. What a brilliant solution you offered, man I just can't thank you enough. You have really helped me and I am so grateful. Cheers!
J
Best posts made by juxta14
-
RE: Help with My Indicatorsposted in Questions & Answers
Latest posts made by juxta14
-
RE: Bucket of Closed Tradeposted in Questions & Answers
Thanks for your help @l-andorrà . Now getting some results using "For Each Closed Trade."
-
Bucket of Closed Tradeposted in Questions & Answers
Hello everyone, help needed with a small project. I want to pull some statistics from closed trades and write to file from a specific currency pair when EA is attached to chart. Attached is what I did but nothing happens. Any help will be appreciated.
Thanks.
https://fxdreema.com/shared/qWWDz0une -
RE: Object on Chart - Price level 1, 2 and 3posted in Questions & Answers
Thanks for the clear and concise explanation, greatly appreciated.
-
Object on Chart - Price level 1, 2 and 3posted in Questions & Answers
Under Conditions, Object on Chart, then Attributes , can somebody please explain or tell me about Price Level 1, Price level 2 and Price level 3. What they are and how to use them?
Thanks
-
RE: Trend Drawdown in a given periodposted in Questions & Answers
Fair enough, I understand. Thanks for the response.
-
RE: Trend Drawdown in a given periodposted in Questions & Answers
What am trying to do is simple.
I look at the last 200 bars on a chart on any time frame.
Within those 200 bars I look for the direction of the trend, which is sometimes obvious and on a choppy chart not so obvious.
In other to determine the trend I have decided to look at close price of bar 1 and bar 200. If bar 1 > bar 200; uptrend. If bar 1 < bar 200; downtrend.
So the blue line is supposed to be the biggest retracement within the last 200 bars which is the highest high to the next lowest low before the chart continues in the upward trend.
-
Trend Drawdown in a given periodposted in Questions & Answers
I am trying to show Trend draw down on a chart.
First I look at the chart and determine the trend direction.
Note, am only looking at the last 200 bars on the right side of the chart.
If price of candle ID 1 is greater than price of candle ID 200 then trend is up, if candle 1 is less than 200 then trend is down.
Now looking at the chat below the trend is up and there is a bit of drawdown indicated by the blue line.
(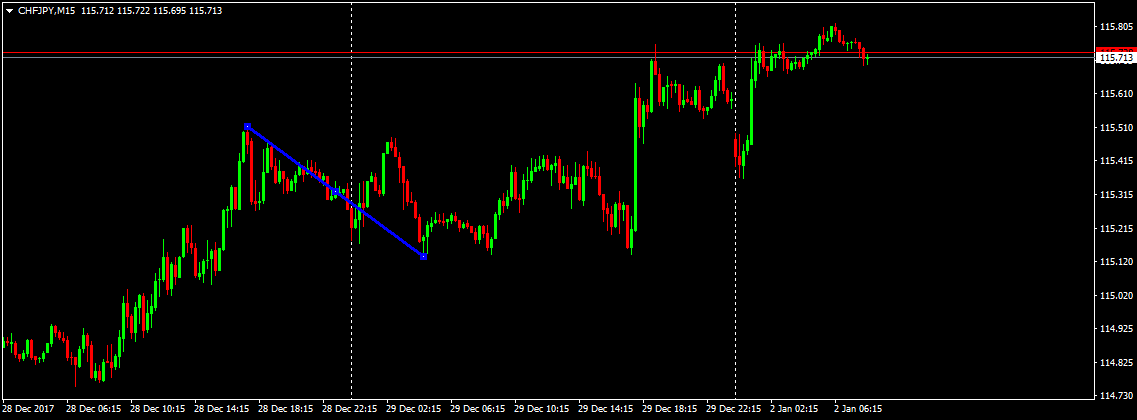 image url)
That Trend draw down identified by the blue line is what I want the EA to draw for me.
Here is what I have coded so far but it’s not working as intended.
https://fxdreema.com/shared/NwuBizIsc
My question is how to manipulate the blocks to show the biggest draw down or pull back in a trend.
Thanks for the help. -
RE: Counting Candle Back over a number of candlesposted in Questions & Answers
Hi the above works great but I ran into problem again trying a different scenerio which is drawing a trend line on the pull back or retracement part of a chart. Example: Looking back 0 to 100 bars we are in an uptrend and price gets to the highest high then pulls back to a low by a couple of candles before continuing in the up trend. How do I define that lowest low after the highest high in this scenerio? You can have a look at the figure below for better understanding Thanks for the help.. image url)
 -
RE: Counting Candle Back over a number of candlesposted in Questions & Answers
Thanks very much for the prompt response. This is what I was looking for. I will try it out. Cheers!
-
Counting Candle Back over a number of candlesposted in Questions & Answers
What block do I use to count back candles example: I want to draw a trendline from the candle with the highest high looking back over the last 100 candles to the lowest low over the same last 100 candles?
Thanks for the help.