I noticed that the block " Set "Current Market" for next blocks " doesn't seem to work properly when there are variables in the strategy or drawings like horizontal or trend lines.
For example, if in the strategy there was a condition to check if the candle (1) crossed above a horizontal line, the EA will only check this on the main symbol, the other symbols will be ignored because in the backtest it is impossible to print this lines on them so the crossover will not happen.
With that in mind, I wanted to know if there is any way we can get around this without having to create a sequence of new rules for each symbol I want to trade.
It's possible ?
Posts made by OntradingX
-
Multi symbols how to use correctly?posted in Questions & Answers
-
RE: I want to get the average price between the 2 prices shown in the Standard Deviation indicatorposted in Questions & Answers
This indicator is standard metatrader 5
But we can get it also on the mql site
https://www.mql5.com/en/code/49 -
RE: I want to get the average price between the 2 prices shown in the Standard Deviation indicatorposted in Questions & Answers
@jstap
But is there any way to get these 2 values?
Can you teach me how? -
RE: I want to get the average price between the 2 prices shown in the Standard Deviation indicatorposted in Questions & Answers
@ontradingx
Being more specific, I want to get the real-time values of the vertical scale of the indicator. -
I want to get the average price between the 2 prices shown in the Standard Deviation indicatorposted in Questions & Answers
Can you help?
Notice that in the image I have:
The highest price 1412.10
The lowest price 286.9
So I did the calculation 1412.10-286.90 which resulted in 1125.20
So I divided by 2 which resulted in 562.60
I added 562.60+286.90 which resulted in 849.50 and so I found the middle between the 2 prices.
But I'm not able to capture the highest price and the lowest price to do this, can you help me find them?

-
Looping to identify which currency has RSI below 30?posted in Questions & Answers
Is there any way in Fxdreema to identify which currency is RSI Below 30 by looping through all of them without having to write their name in some block?
Looping to identify which currency has RSI below 30?
When identified, the EA just prints the name of the currency on the screen through a variable. -
RE: Automated distance calculation. How to make?posted in Questions & Answers
@tipsywisdom could you give me an example of how to do this?
-
Automated distance calculation. How to make?posted in Questions & Answers
Does anyone have any idea how I can perform distance calculations between objects in a simpler and more automated way?
Currently I have to figure out which distance multiplier I should use to plot other lines on the chart.
I will cite some examples:
Note my lines R1, R2, R3 they are symmetrically spaced but for this to happen I had to multiply by x1000 note that the asset price is in the format 000,000In this case I'm using the Crypto market, but if I'm going to trade Forex, then I have to multiply it by x10000
If I'm going to use it in CFD I have to multiply by x100And these multipliers change from broker to broker.
Is there a way for the EA to find the ideal multiplier according to the price or something similar so that I don't have to keep trying to figure out this part?

-
RE: Market aggression meter.posted in Questions & Answers
@jstap I believe then that the number of ticks is not so important to define a trend even if this trend is short.
-
RE: Market aggression meter.posted in Questions & Answers
@jstap
In my understanding it is:
If I have more buy ticks it means the market is going up
If I have more sell ticks it means the market is going down.So if we have a day when the market goes up, my variable will indicate UP
If we have a day when the market went down, my variable will indicate DOWNDo you understand it this way too?
-
RE: Market aggression meter.posted in Questions & Answers
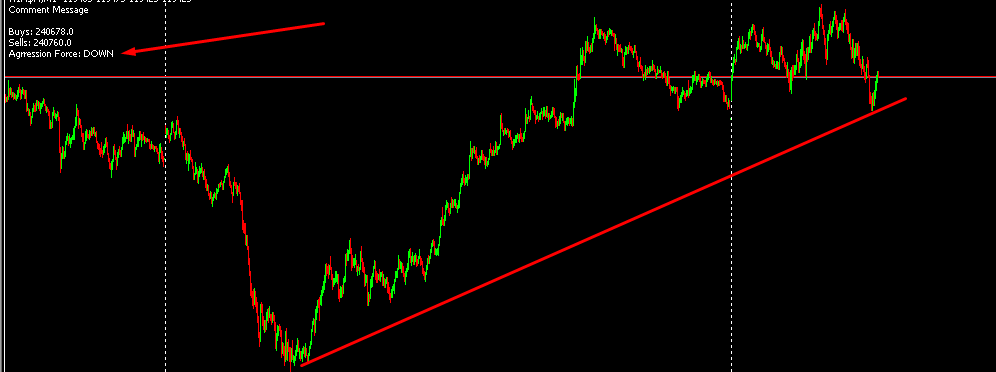
I'm not understanding why it just gets Down.
Can you help me?
It is as if the counter is only favoring the ticks down, but notice that the market has gone up.
https://fxdreema.com/shared/y6tBFsV9e -
RE: Market aggression meter.posted in Questions & Answers
@jstap Thanks for your help.
Can you help me a little more?
I notice that he is resetting the values with each new candle.
Would it be possible that he didn't reset?
I wanted to add the total values in real time. -
Market aggression meter.posted in Questions & Answers
Hello friends, I know that some will say that there is already an indicator but in reality what I see is that most indicators are not delivering true data.
So I wanted to create my own calculation for this but I would like your idea.
I would like to perform a tick count and separate this amount for sellers and buyers.
Can someone help me?So let's use an example of investigating Candle (0-current)
1st part.
If the opening of the candle happened at the price 1000 and the bid price oscillated down by 1 point or 999, this (1) tick is a seller.
But if it fluctuated above 1001 then this (1) tick is a buy.
Any tips on how I can create this condition and separate it into variables?2nd part.
After part 1, we can then continue adding this information for every new candle id 0 that appears and we will then be able to identify who is acting more strongly (buyers or sellers).3rd part. Perhaps the most difficult.
Identify if in candle 0 there was some kind of very fast price variation, either for buying or selling.
If we are on the 1 minute timeframe, then let's say that as a rule most candlesticks have about 1000 ticks being (500 buyers and 500 sellers) but there happened to be 5000 ticks (4000 buyers and 1000 sellers) this could then be considered an aggression by buyers on the current candlestick. -
RE: Forecast of the sum of Stop Loss Calculation of pending or open ordersposted in Questions & Answers
@ontradingx @l-andorrà
Hi friend, I think I figured it out.
I used the Bucket of positions and "Average Value" block, then I created a few more blocks to calculate the average value of all orders by multiplying by the number of orders and with the price where I want my stop loss target to be.
I haven't finished it yet because the calculation is getting more complex as I progress in creating my EA idea, but it's already one more stage won.
Thanks for making it available to try to help me, I'm often too slow to think about these crazy calculations I want to do in this thankless market heeheh -
RE: Forecast of the sum of Stop Loss Calculation of pending or open ordersposted in Questions & Answers
In my strategy for some markets, I consider this management to be ideal because it allows you to inform, according to your account balance, how much you would bear if the market went against you, and in this way it would show you exactly the size of your maximum loss even before you authorize the opening of the first order. Manually I've been using it since 12/2020 and my account is with + 800% profit, now I want to automate it. In short, I initially want the calculation to be with pending orders. If I place 10 pending orders on the chart with a distance between them of 100 points and the stop loss of all of them I set to be equal at the same price at 1500 points away from the first order, what would then be the negative value that would be caused if the market hit the stop loss and close all orders? this is what i want. display the total stop loss value of the sum of all orders.
-
Forecast of the sum of Stop Loss Calculation of pending or open ordersposted in Questions & Answers
Can you help me?
I want to work with pending orders and already open orders.
All of them will have the same Stop Loss price in the case of a line that I placed on the chart and named as StopLoss.I want my EA to calculate the negative stop loss value of each order individually and add up all these values.
Imagine as in the image below:
I have order 1 open at the price 1880.434 and the white line is at 1859.633
So if we perform the distance calculation we have a distance of:
1880,434-1859,633=20801 points
(20801=distance from opening price)*(current lot 0.07)*100=USD -145.61Now imagine I have a second open order:
1870,622-1859,633= 10989 points
(10989=distance from opening price)*(current lot 0.07)*100=USD -76.92The sum of these 2 orders should then be USD -222.53
In short, I want my EA to be able to get the negative value that each order will cost if a certain market value is set by me and add all these values together.
Can you help me find this out?
For just one order it is very easy but to do this calculation with several orders I am not able to.
-
Put the indicator code directly into the EA.posted in Questions & Answers
Is there any way I can put the indicator's source code directly into the EA?
I saw an EA that works with a custom indicator, but I didn't need to download the indicator from the internet to use the EA.
Probably the developer with the intention of not finding out what the indicator and its calculations included in the entire source code of the indicator internally in the robot.
Does anyone know how to do this in Fxdreema? -
RE: Order opening based on remaining timeposted in Questions & Answers
@tipsywisdom
Sorry friend, I don't understand what you mean, can you clarify?
Was it something positive or negative?