@tt
Do you mean if we have a bought version of the builder or ?
S
Posts made by seb 0
-
RE: Help please! EA that trades Parabolic SAR signals with 200 moving average.posted in Questions & Answers
-
RE: Do you use your EA for live trading?posted in Questions & Answers
@l-andorrà
The God of Forex heard you
-
RE: Help please! EA that trades Parabolic SAR signals with 200 moving average.posted in Questions & Answers
@tt
You can't compare the MACD signal line value to the moving average.
The value of the macd signal line is the difference between a fast and slow MA, smoothed.
It doesn't make sense. -
RE: Help please! EA that trades Parabolic SAR signals with 200 moving average.posted in Questions & Answers
@tt
Can you share your nonfunctional project please ? -
RE: Do you use your EA for live trading?posted in Questions & Answers
@l-andorrà
Does it not only to improve himself but also because he seems to be a really generous person who likes helping each other. He is not answering only pertinent questions, he's answering all of them.. I'm sure he will end finding a good EA : ) -
RE: Control Panelposted in Questions & Answers
@ramisignals
Hum is it a question or a contribution ?
There is a infinite number of button possibility.. -
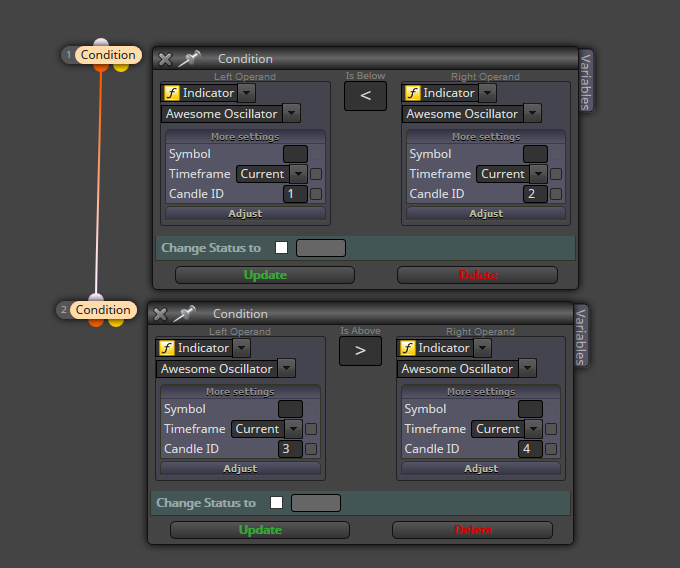
RE: OPEN A SELL TRADE AFTER A BIG BULL CANDLE AND AFTER THE SECOND RED BAR IN AWESOME OSCILATORposted in Questions & Answers
@fabcast95
Can you stop posting in the "Tutorials" section please, ask you questions in the "Questions and answers" instead.
Thank you -
RE: Close trade at horizontal line priceposted in Questions & Answers
The link you pasted isn't clickable
-
RE: Trendline from 2 to 12, Price at 0 goes > or < than it, buy, sell....what am I doing incorrectly? S.O.S.!!! Here is a link...posted in Questions & Answers
The high of the candle 0 is also the close of the candle 0(on a bull candle). Put "close of candle 1" instead(block 102).
-
RE: Setting start grid for EAposted in Questions & Answers
@oracle-0
Woops didn't read you well
If you want the grid to be X pips far from the current price why don't you modify "Base price: Offset" to X ?
If you want the base price to be modified, click the "adjust" button then write : +/- X pips -
RE: How can I turn DD into a percentage?posted in Questions & Answers
Yes, from what i got from the internet :
- Absolute draw-down = lowest equity value - initial equity value (capital) --> if <0, =0
- Max drawn-down = Max : (Equity peak - Equity subsequent through)
- Relative drawn-down = Max drawn-down / Equity subsequent peak
-
RE: Setting start grid for EAposted in Questions & Answers
@oracle-0
I don't think only grid pending order based strategy is good though
https://fxdreema.com/shared/ftog5qCld -
RE: 3-conditions-robotposted in Questions & Answers
@mahdi-1
I'm not sure this is clear.
Do you want rsi>30 or rsi<30 ? Usually for buy signal, it's the second option.
Do you want the divergence to have any limitations, like the 2 points must be maximum 20 bars far each one from each other ? Does the rsi must cross above the 30 level between these 2 points ?
Also if you want the divergence to be detected, and in the same time the candle to be between BBs, and in the same time the MACD to cross above main, you are not gonna have a lot of opportunity. -
RE: Question for experienced backtestersposted in General Discussions
Got the answer.
For those who are interested, I am on XM and this broker doesn't permit to modify/import the data as XM MT5 is a "standard platform". -
RE: Video Tutorials for fxDreema.posted in Questions & Answers
@waremock
I know miro1360 and l'andorrà have made some youtube videos
Otherwise you can try typing FxDreema in youtube -
RE: Time Based Price Action searchposted in Questions & Answers
@jsauter86
In this example,
https://fxdreema.com/shared/xQhnUDfI
whenever the candle 1 > candle 10(at any moment before 14 pm), as soon as it is 14 pm -> Buy.
Is that what you need ? -
RE: help!!!posted in Questions & Answers
@trades07
I never used this market propriety parameter but, from what I get the pivot point uses in its formula the Close of the candle. However the candle you designed has no ID (= ID 0), and the candle 0 (actual one) isn't closed yet. So no close value. Try to write an ID number of 1 at least. -
RE: EA dumpposted in Tutorials by Users
@roar
It actually is more difficult to simulate than I thought. Cause in case of a prolonged down trend, the consecutive sell signals will make increase by much this no-stops short position, I guess that's why the lots sensitivity is needed ?
On a 3 years sample the results of my strat looks good but its probably not significant enough.
I am currently switching to FXTM, so i will be able to test the EA on a larger sample, and with this more relevant netting method. If the results are still good I will tell you
-
RE: EA dumpposted in Tutorials by Users
Dang i missed this topic!
That actually is really cool, i didn't get the netting method right, i thought it was the fact to accumulate the trades of a same type... Now it opens up many perspectives to me. If I don't have a netting account I still can simulate it with a simple close trades(sells when buy signal) block right ?
Your strategy looks pretty simple and effective. On a higher timeframe wouldn't the PriceMouvement/Spread ratio still give better results ?
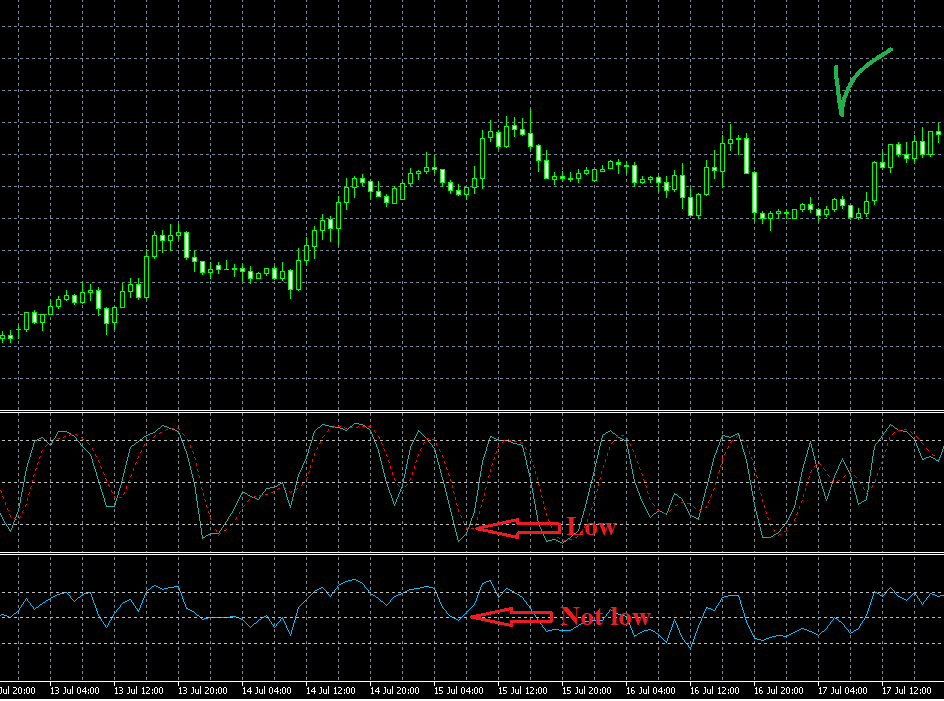
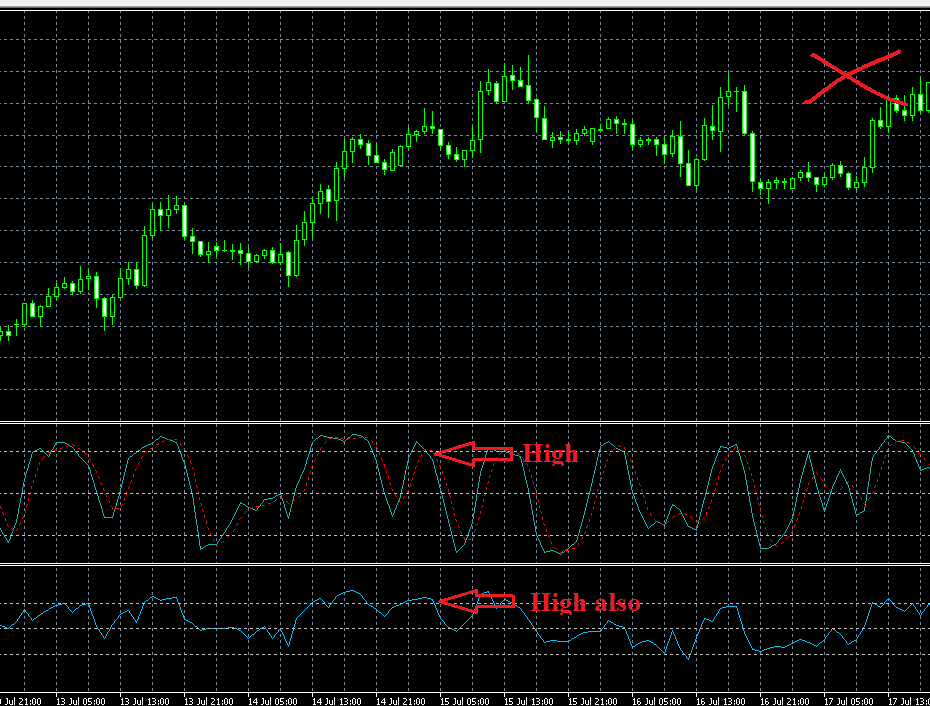
Talking about that i just found a simple configuration that also seems to give good results. Here is what it is :The excessive value of the stochastic oscillator occurs when a price movement is significant compared to the recent range so
in a up trend ::::::
-the downward oscillation will not be overpassed by much by the recent range as soon as this trend is not too aggressive so the Stocha will be low. (fig 1)
-In this same situation the RSI will not go down by much because we are in a uptrend so the downward oscillations are hampered by the fact that we are in an up trend. (fig 1)
In a up trend :::::::
-the upward oscillations will make the Stocha oscillate as much(as the downward oscillations) (fig 2)
-however the upward RSI oscillations are gonna be amplified by the fact that we are in an up trend (fig 2)
Conclusion(mine) : The good signals should occur when the value of the Stocha is excessive, but not the one of the RSI.
The periods of the indicators need to be adjusted, and I added an minimum ATR value so the little price movements during flat market are not taken as signals.
The good thing about the strategy is that the trend taken in count by the indicators divergence, is a really recent one, so the lag is really low.
https://fxdreema.com/shared/cYklE3lHc