#Overview
The next information applies mostly to the Condition block and it's crossover abilities ×< and ×>. First let's see how bars (candles) are indexed on the chart. We need to know this, because we are going to detect crossovers between indicator lines, and those lines are closely related to the bars.
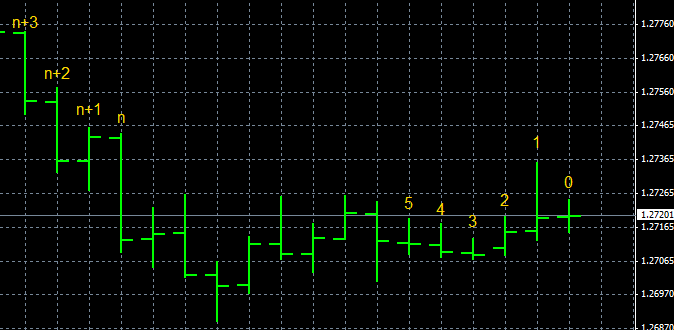
Each bar from the chart has its own index (number, address, shift or ID - name it as you like it). The newest bar on the chart (the current one) has index 0 and the index increases as we are going into the history. Basically, the number tells us how far from the current candle is each other candle. What is now candle with index 5 will be candle 6 when a new candle is created.
Fact: Negative values (from the future) are in fact also possible and this can be seen in the built-in indicator Ichimoku Kinko Hyo.
Note: In "Condition" block there is a parameter named "Candle ID" (first click on "More settings") that represents the bar's index.
Now let's see how we can detect crossover in few different ways.
#Crossover Between Two Indicator Lines
If Indicator A and Indicator B are like Moving Average, then here is how they are crossing:

Both indicator lines are made out of many points, one for each bar on the chart. All points are visually connected to form those lines. If you zoom in your chart enough, you will see these points very clearly.
Crossover happens when for a given bar line A is above line B and for it's neighbour bar line A is below line B. Or vice versa.
- Line A crosses Line B below when: A[bar] < B[bar] and A[old bar] > B[old bar]
- Line A crosses Line B above when: A[bar] > B[bar] and A[old bar] < B[old bar]
This is how it the Condition block looks like:

Candle ID is where we specify the candle index. But while we can only see 2 indicators, 4 different values are used to detect the crossover. It looks like this:
- Line A crosses Line B below when: A[Candle ID] < B[Candle ID] and A[Candle ID + Cross width] > B[Candle ID + Cross width]
- Line A crosses Line B above when: A[Candle ID] > B[Candle ID] and A[Candle ID + Cross width] < B[Candle ID + Cross width]
As you can see, there is additional Cross width parameter which tells you what is the relative index of the oldest candle that is used. This value is by default 1.
#Crossover between indicator line and a value
It is possible if the value doesn't change very much over the time!
- Line crosses 1.066 below: Line[bar] < 1.066 and Line[previous bar] > 1.066
- Line crosses 1.066 above: Line[bar] > 1.066 and Line[previous bar] < 1.066
#Price vs Indicator Crossover - how NOT to do it
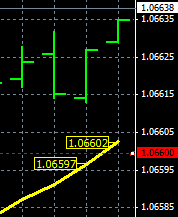
Now this is tricky, because the current price (Ask or Bid) is a value that changes over time and it does than in irregular steps. More than that, indicator values also change because of the price. Let's see an example:
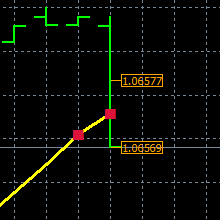
We want to detect the moment when the Bid price crosses below the Moving Average line. We have two indicator values - the current one and the previous one (look at the red dots). The Bid price is obviously falling down. Now imagine that Bid jumped from 1.06577 to 1.06569 directly, with no ticks in between. This movement is less than a pip and it happens very often. In the previous moment Bid was above both indicator dots and at the current moment it is below both of them. Crossover was not detected and cannot be detected now. Only if the price jumped somewhere in between both indicator values, we could detect a crossover, but there is no guarantee that this will always happen.
#Price vs Indicator Crossover - Different ways to do it
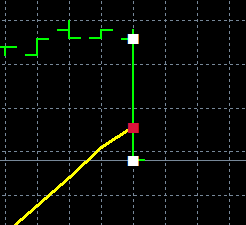
Candles capture price movements in some way, so they contain information where was the price before and where it is now. Also, indicators calculate their data by using information from the candles, so it's very natural to detect crossover between a candle and an indicator line. The right conditions to check here can be like this:
- Price crosses Indicator line below: Candle Close[bar] < Indicator Line[bar] and Candle Open[bar] > Indicator Line[bar]
- Price crosses Indicator line above: Candle Close[bar] > Indicator Line[bar] and Candle Open[bar] < Indicator Line[bar]
#"Price ×< Indicator" and "Price ×> Indicator" blocks
Yet another way to detect crossovers. These blocks monitor the Bid price and can detect when on the previous tick the price was on the other side of the value in question. Very similar to the crossover above (with the Open and Close prices), but instead of Open and Close we have the previous and the current Bid price, so we are working on a "microscopic" level.
Note that when this happens, it is more like an event, not a state like in the crossover methods explained above. For the other crossovers we have something like a state when Candle Close and Candle Open are above and below from some value for example, and this state could be true for tens of ticks ahead. While here because we are looking at the previous tick and the current tick, we can say that this crossover is an event.
#Examples
Crossover: Indicator vs Indicator
Crossover: Price vs Indicator
Crossover: Price vs Indicator - alternative method