My EA update
-
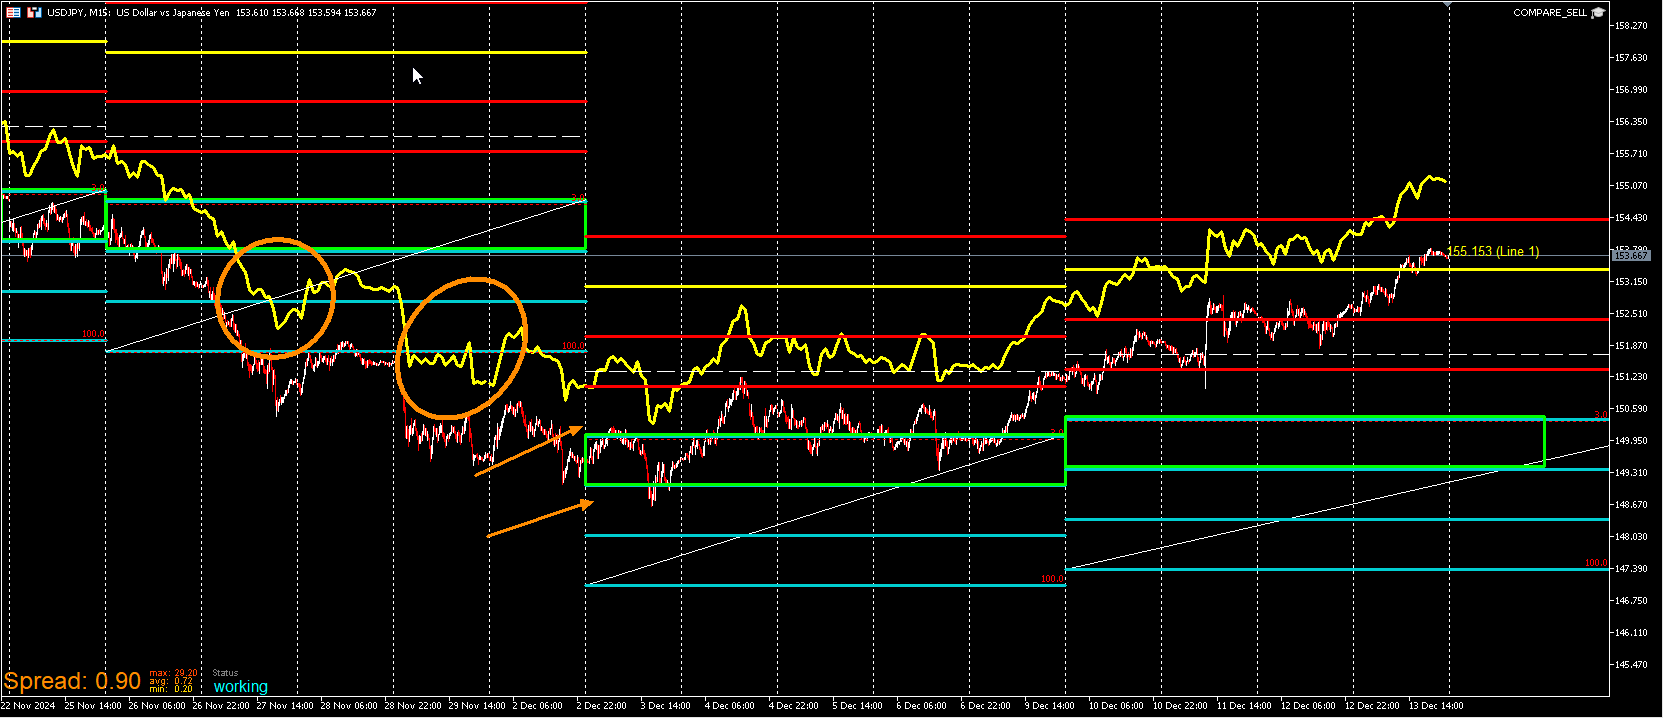
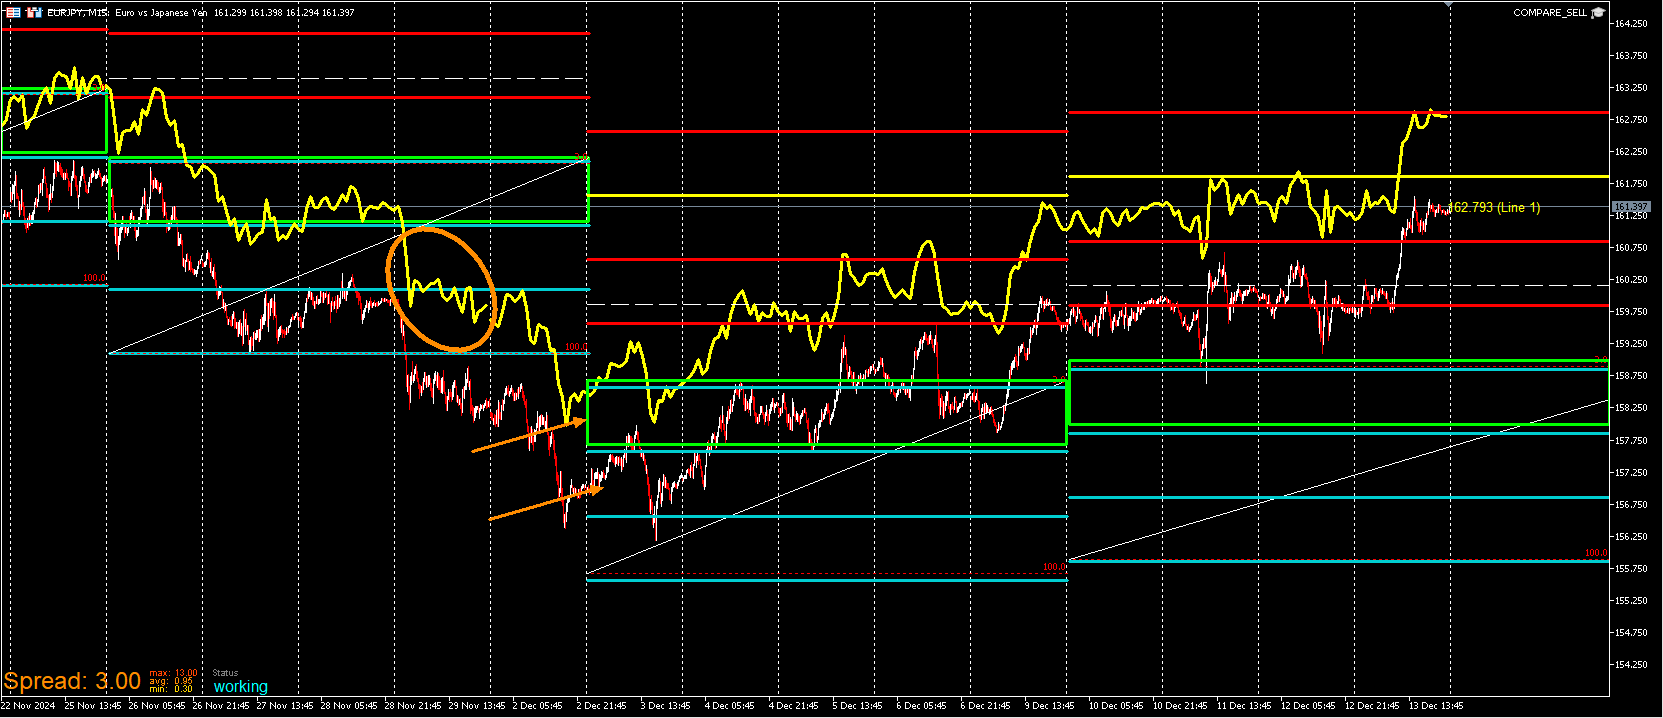
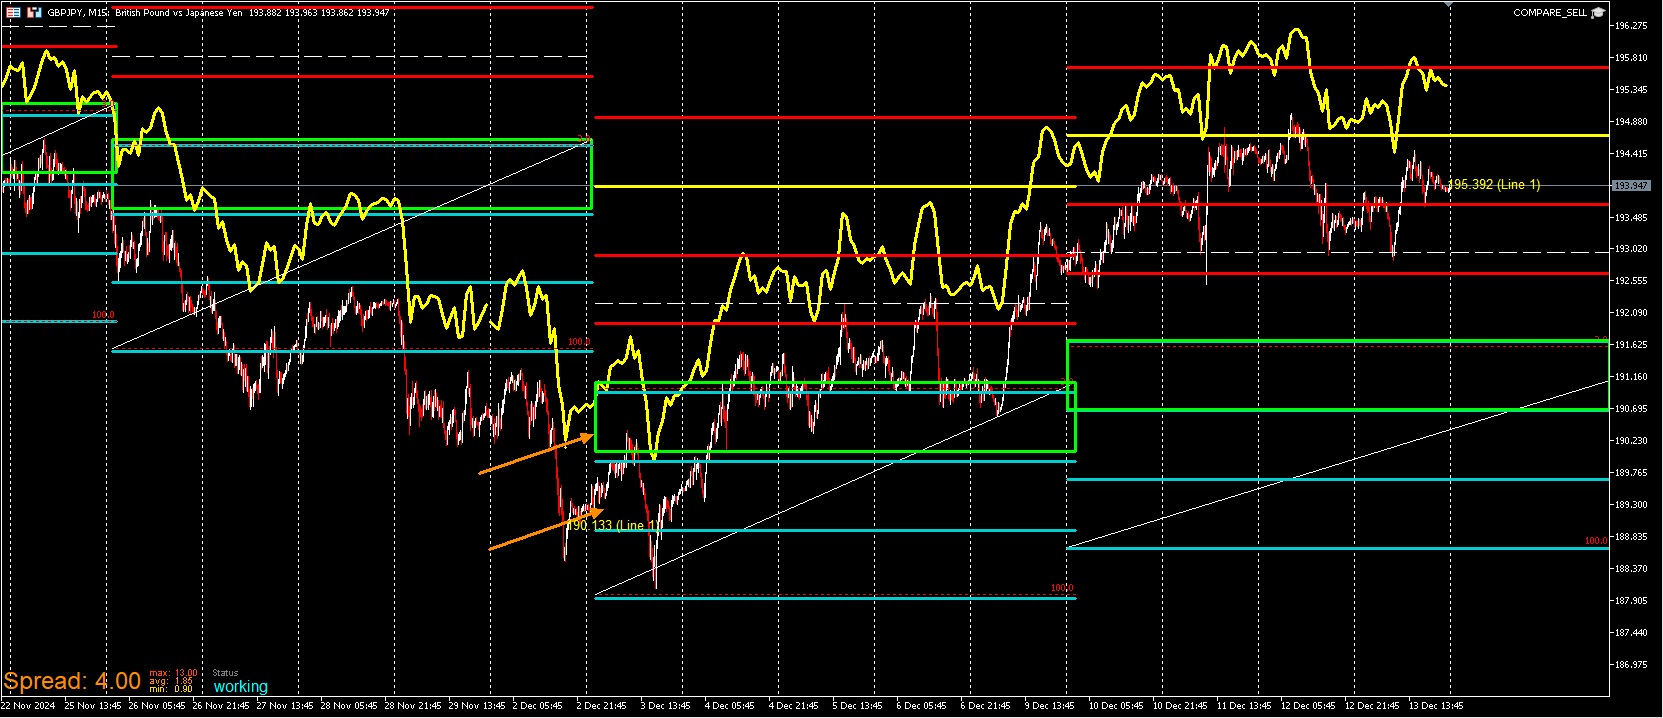
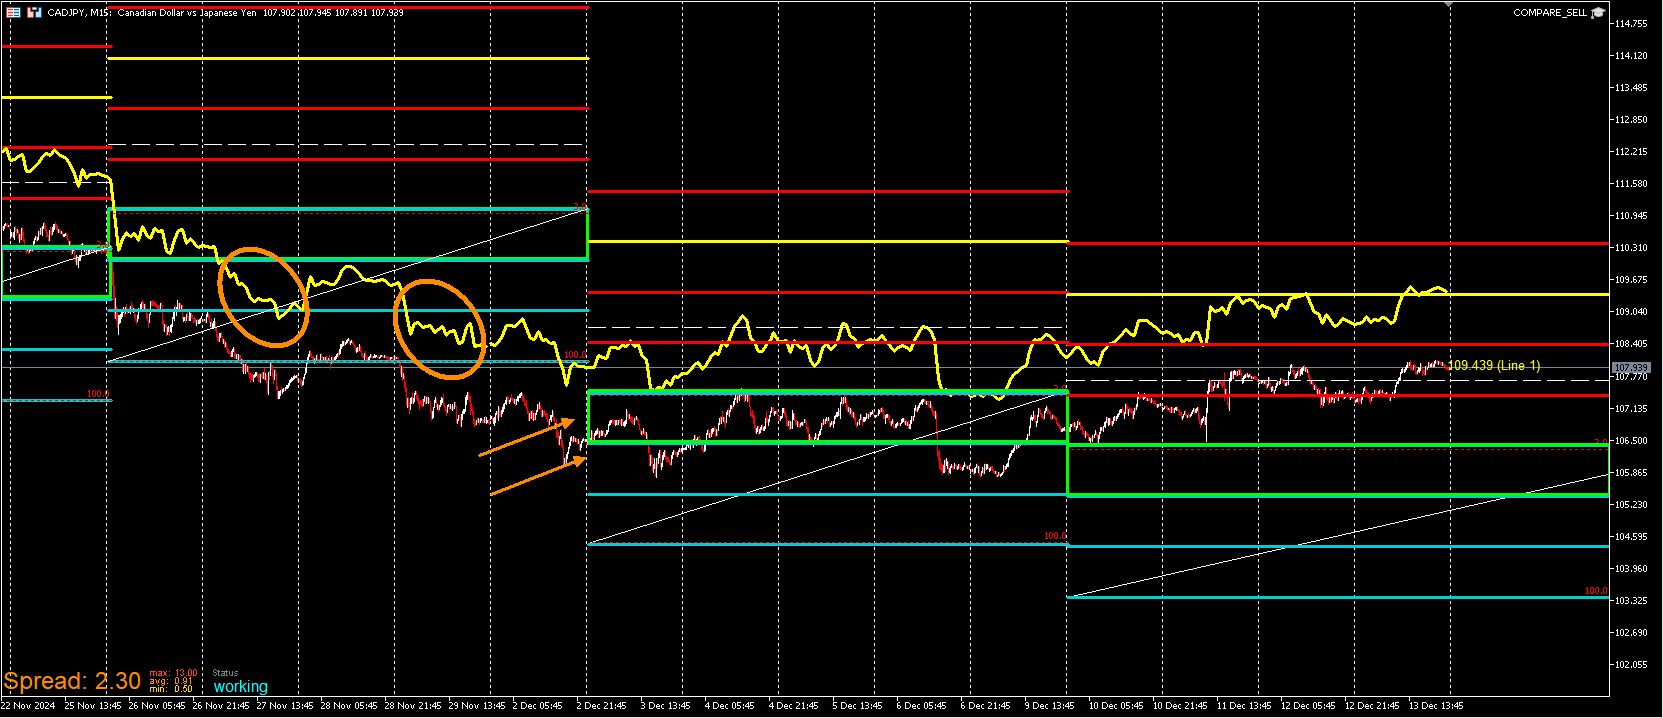
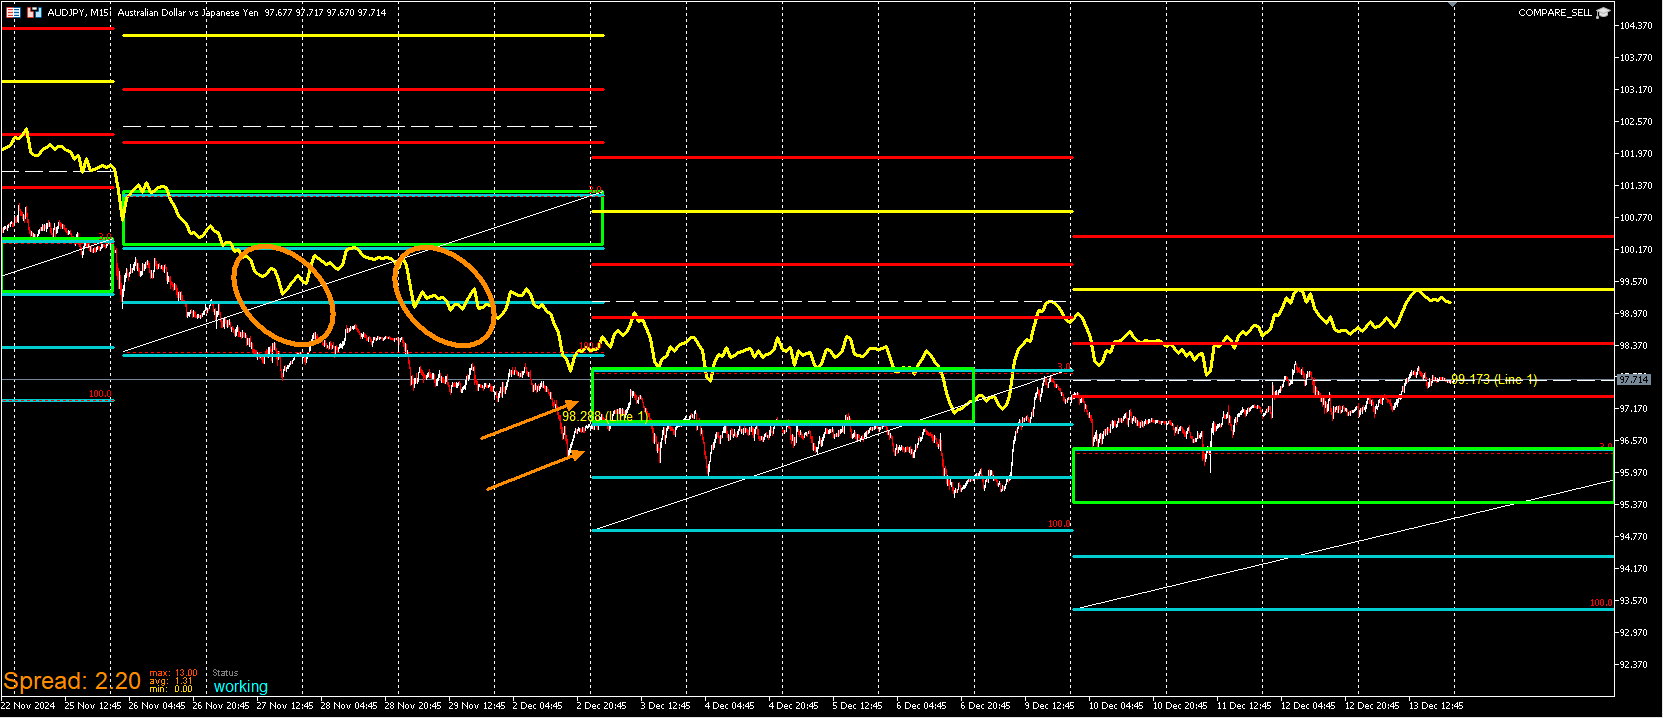
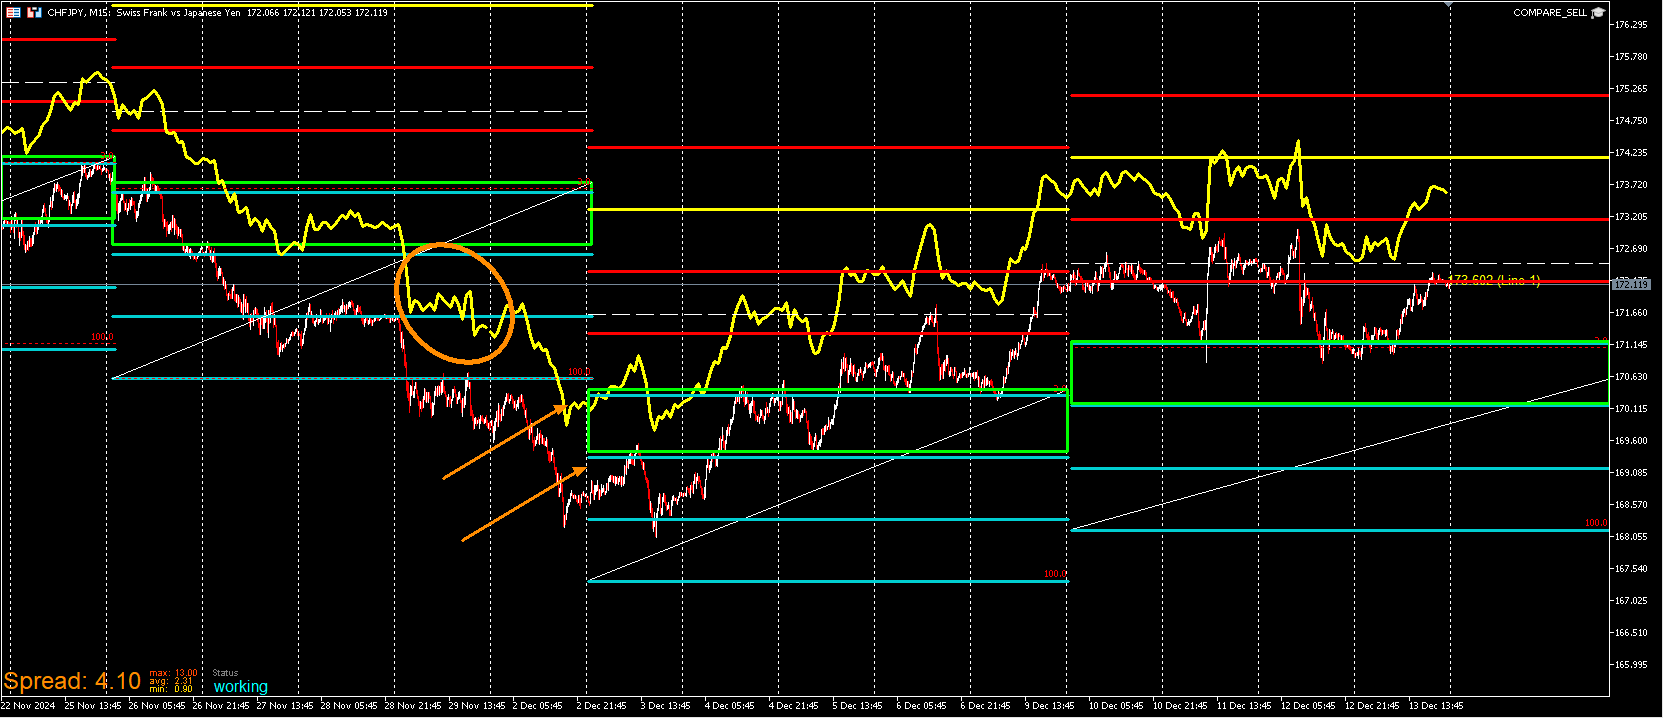
Here are the results so far for the Yen pairs.
-
EUR/CAD & EUR/USD


-
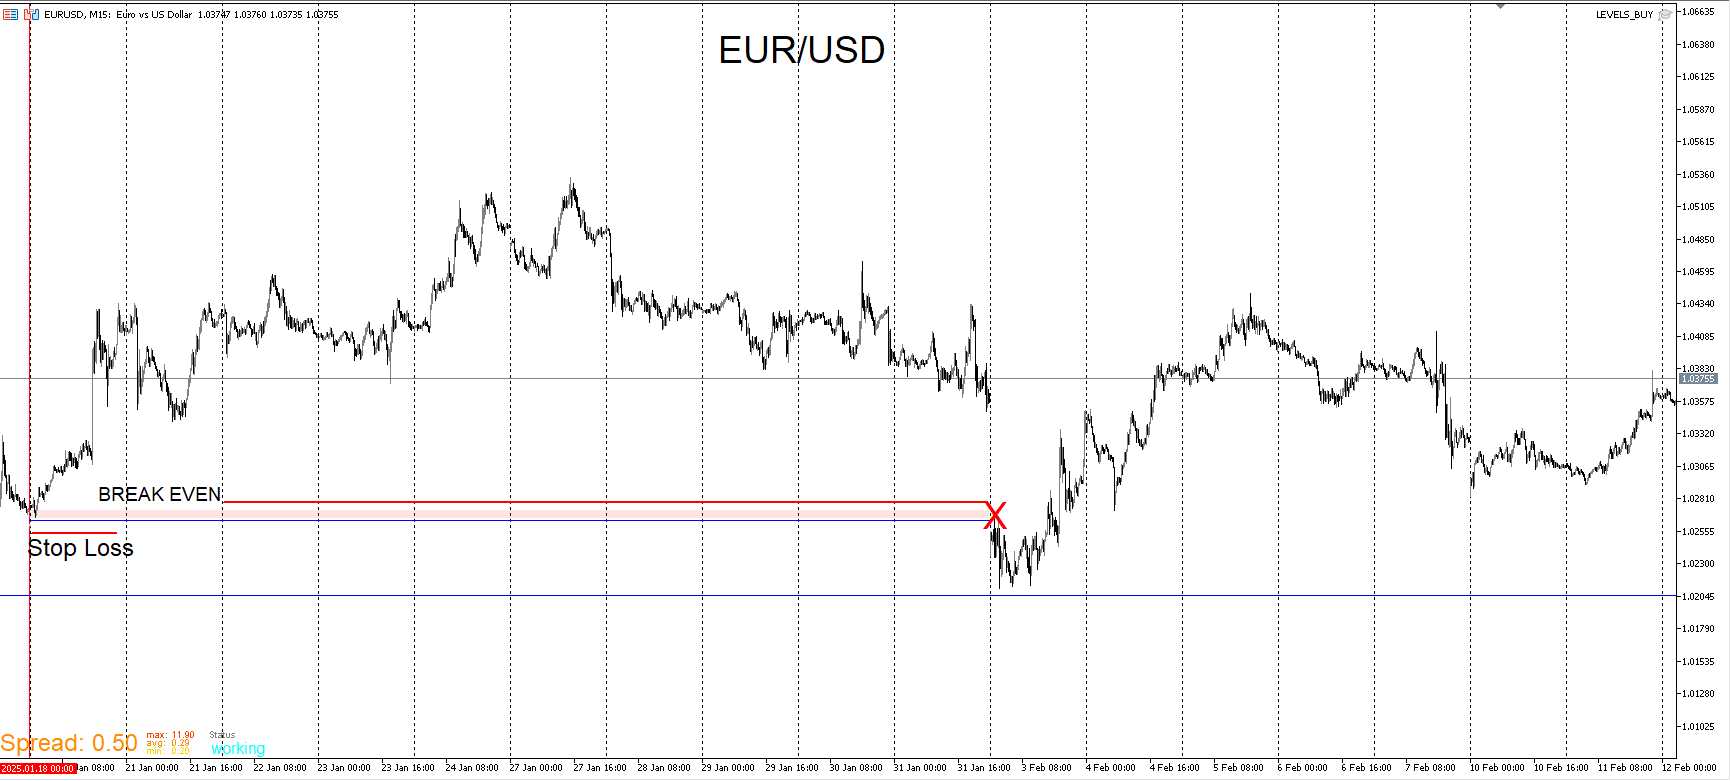
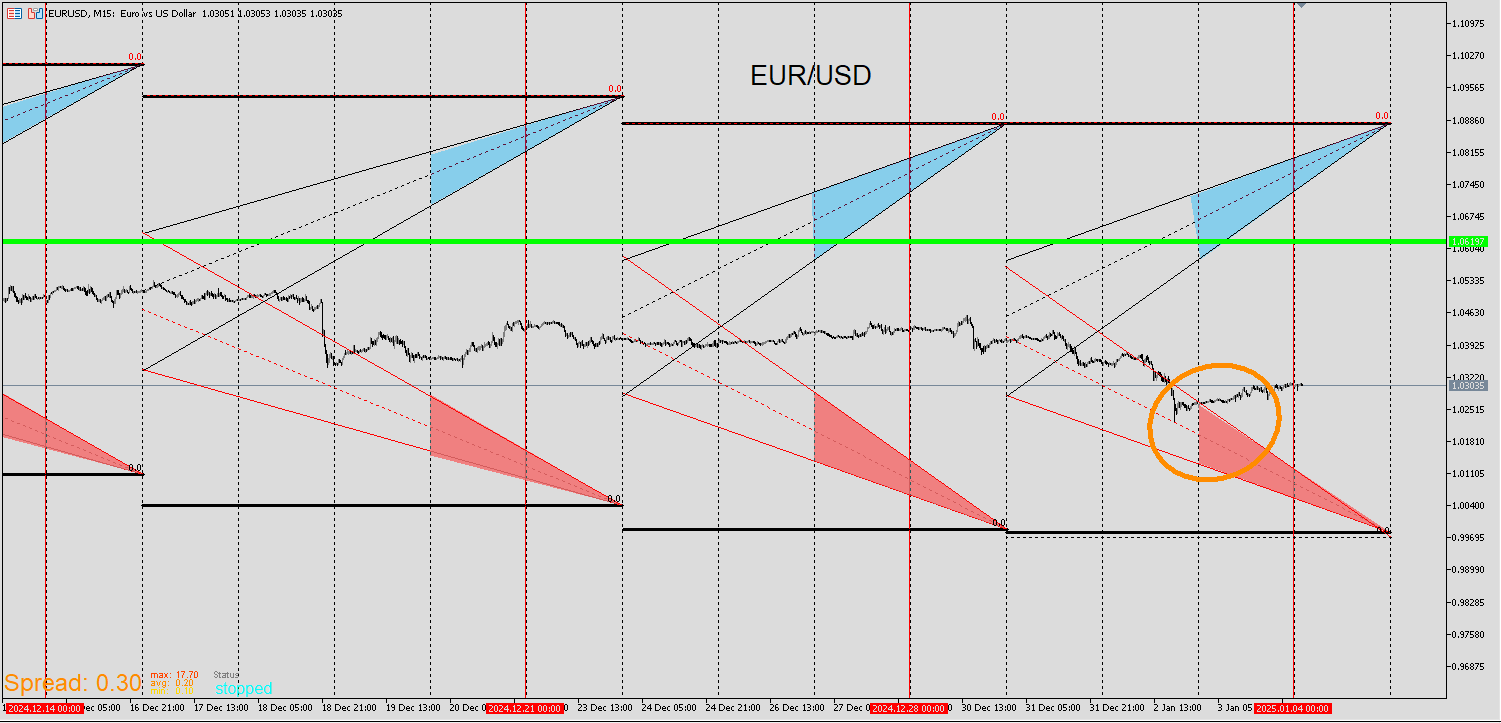
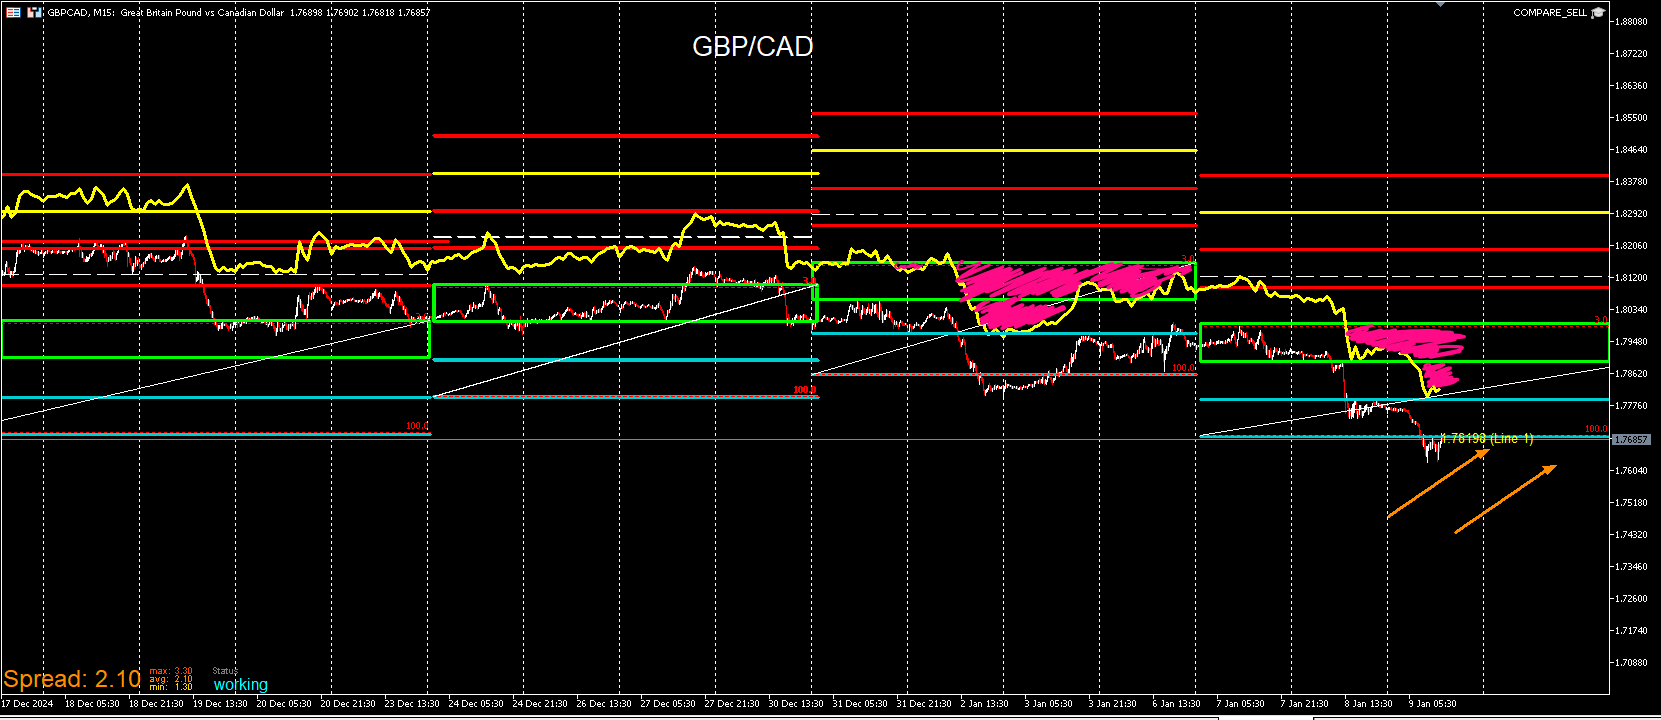
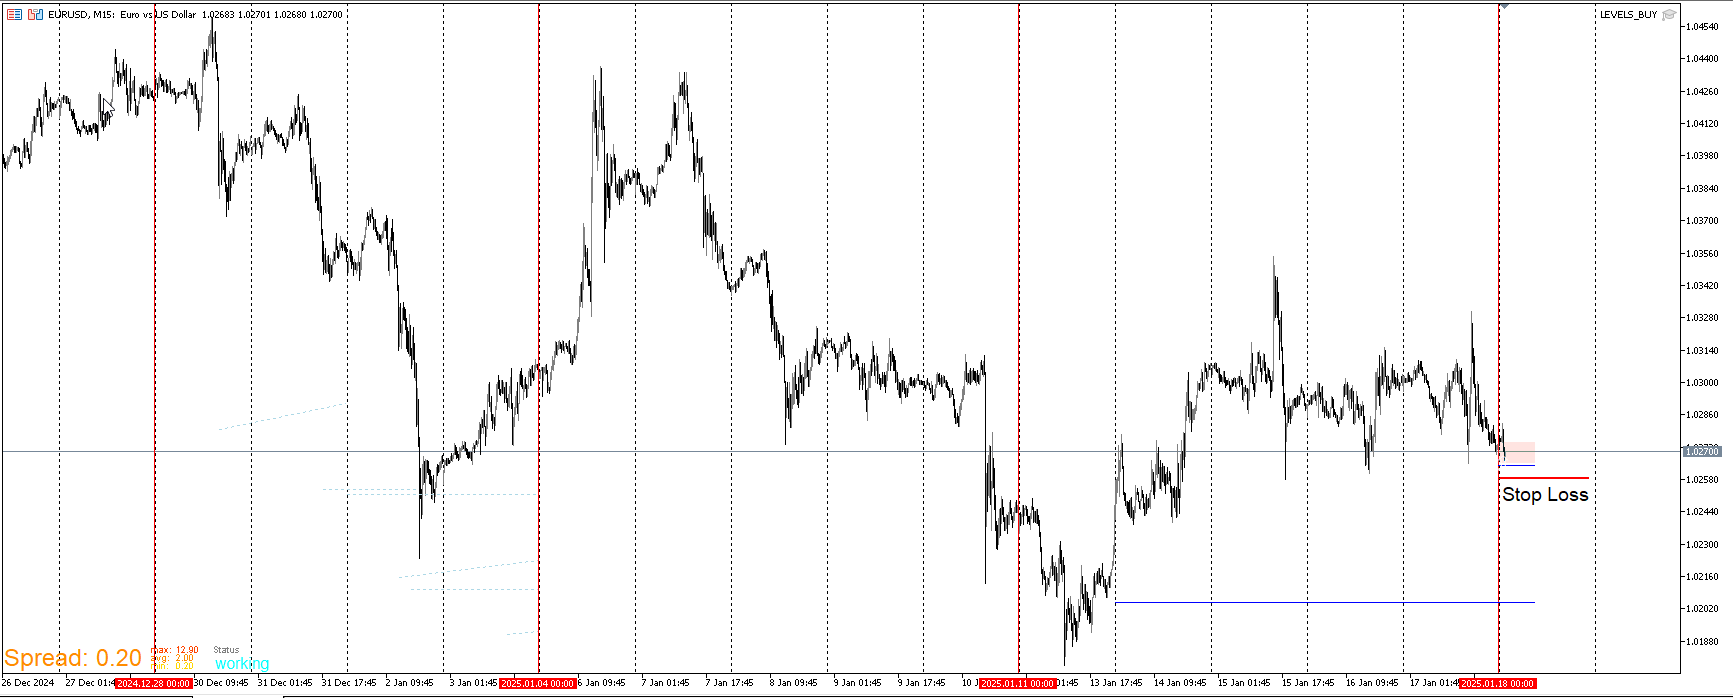
Back with some updates. The first pair I am covering is EUR/USD. It's a similar setup to the last time I posted and at the time I preferred price to go lower. It did rise but spent most of the month sideways. The flush down during the US session on Thursday are the levels I've been looking for. I entered on Friday with a small position after the High tracer came within the green box. I saw this as a low risk entry along with other factors.
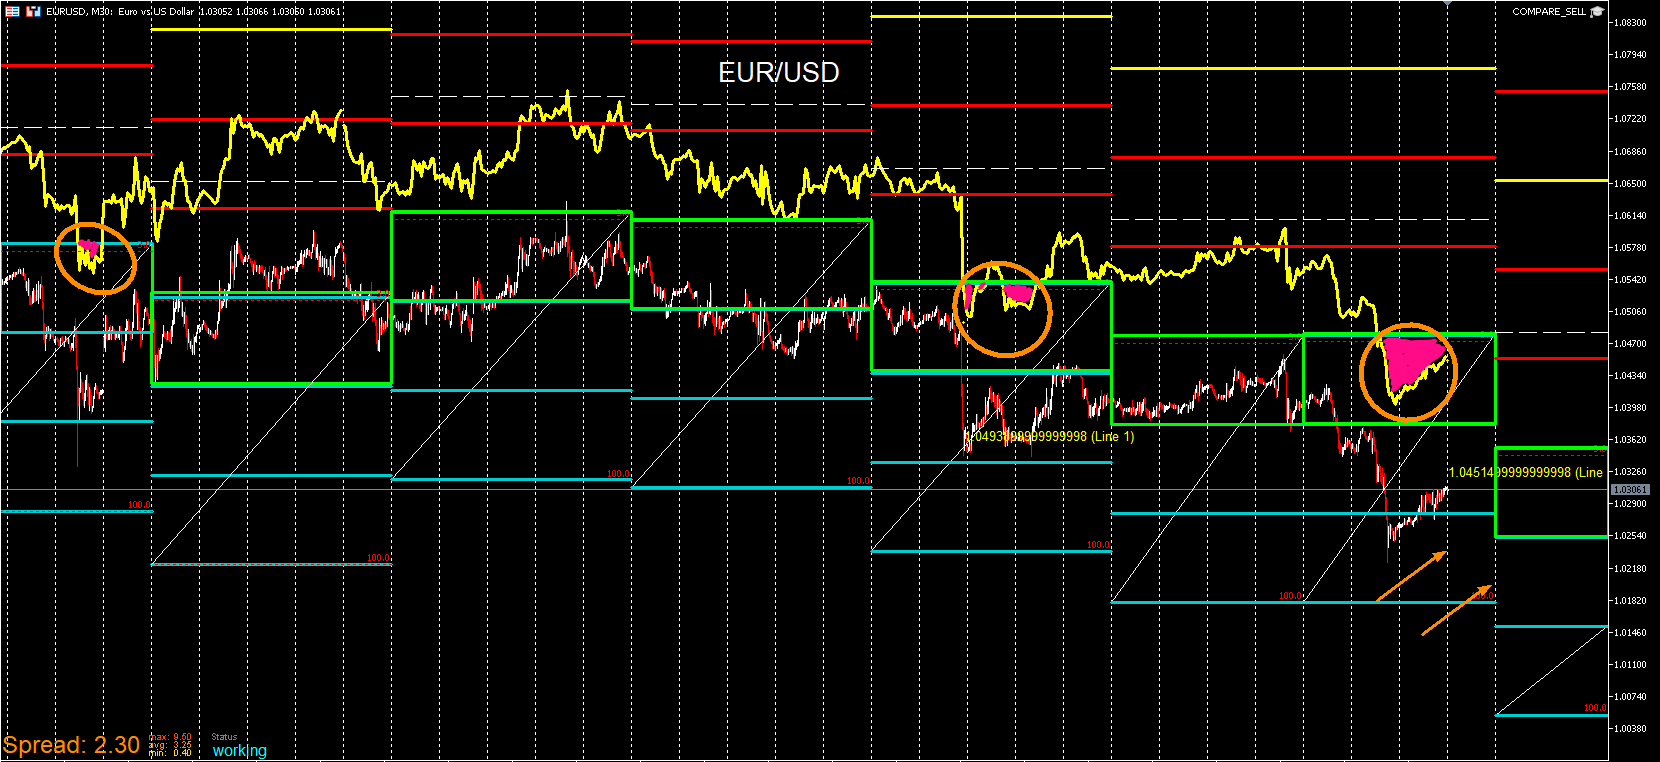
Price has also neared the bottom ribbon and is still deep below the green line.Given the consolidation, it hasn't gone above yet.
-
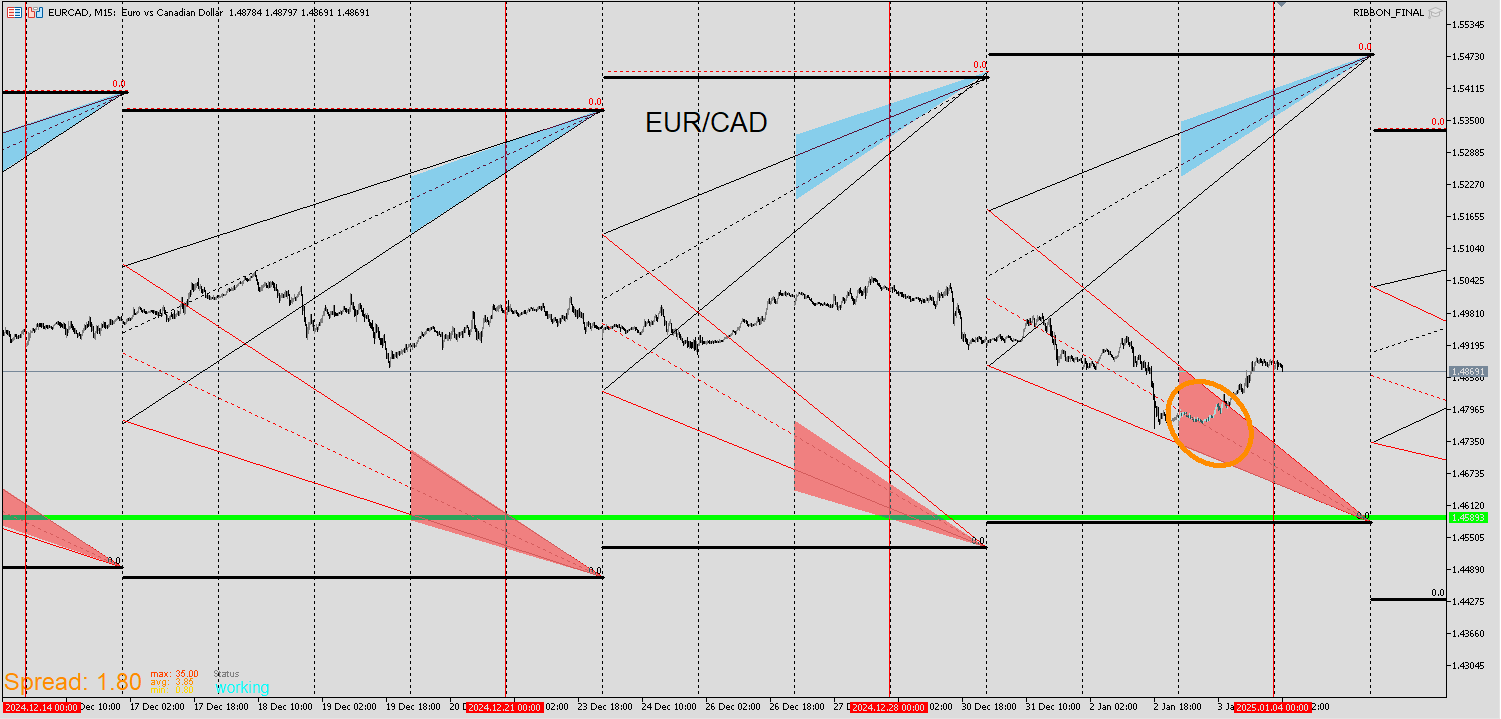
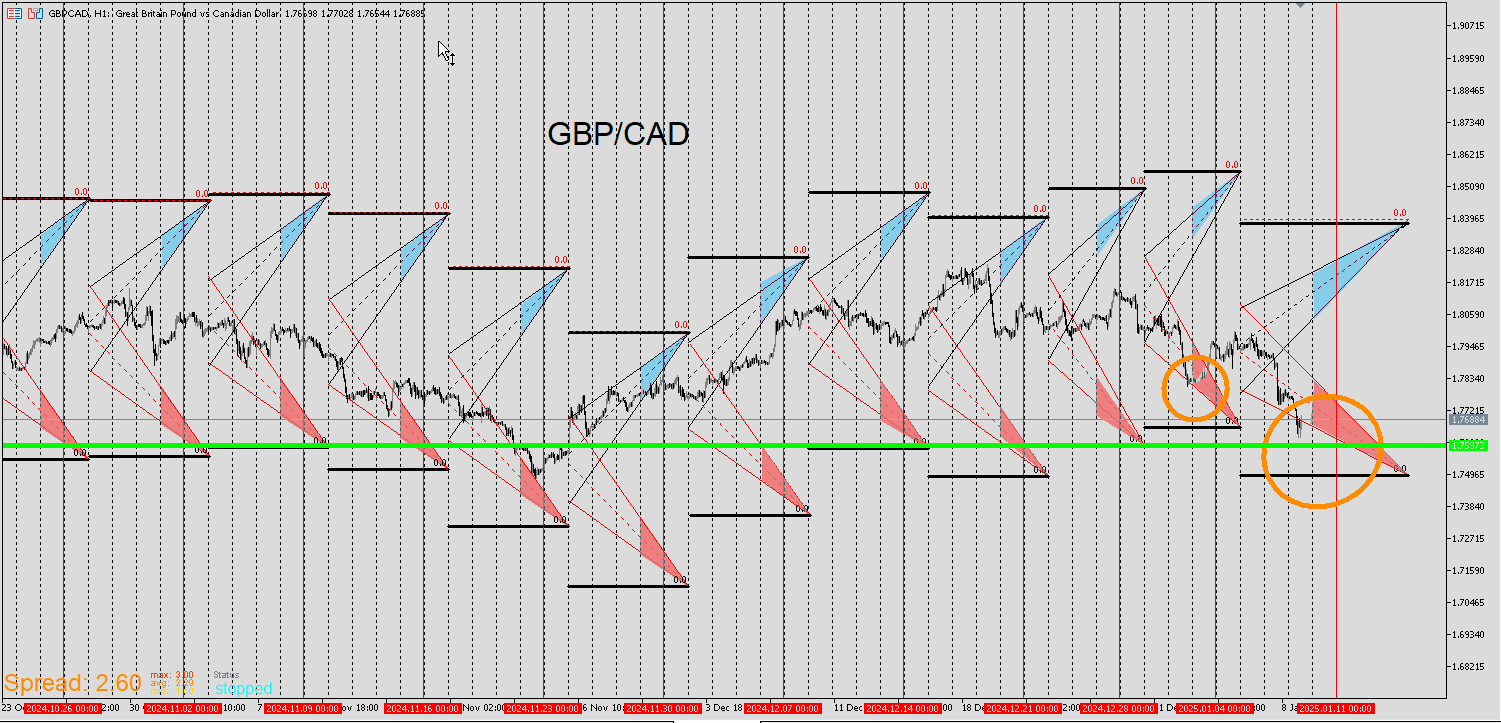
EUR/CAD
I entered on here as well. I think that it may be a continuation back up and if it is, this is where I see a good entry.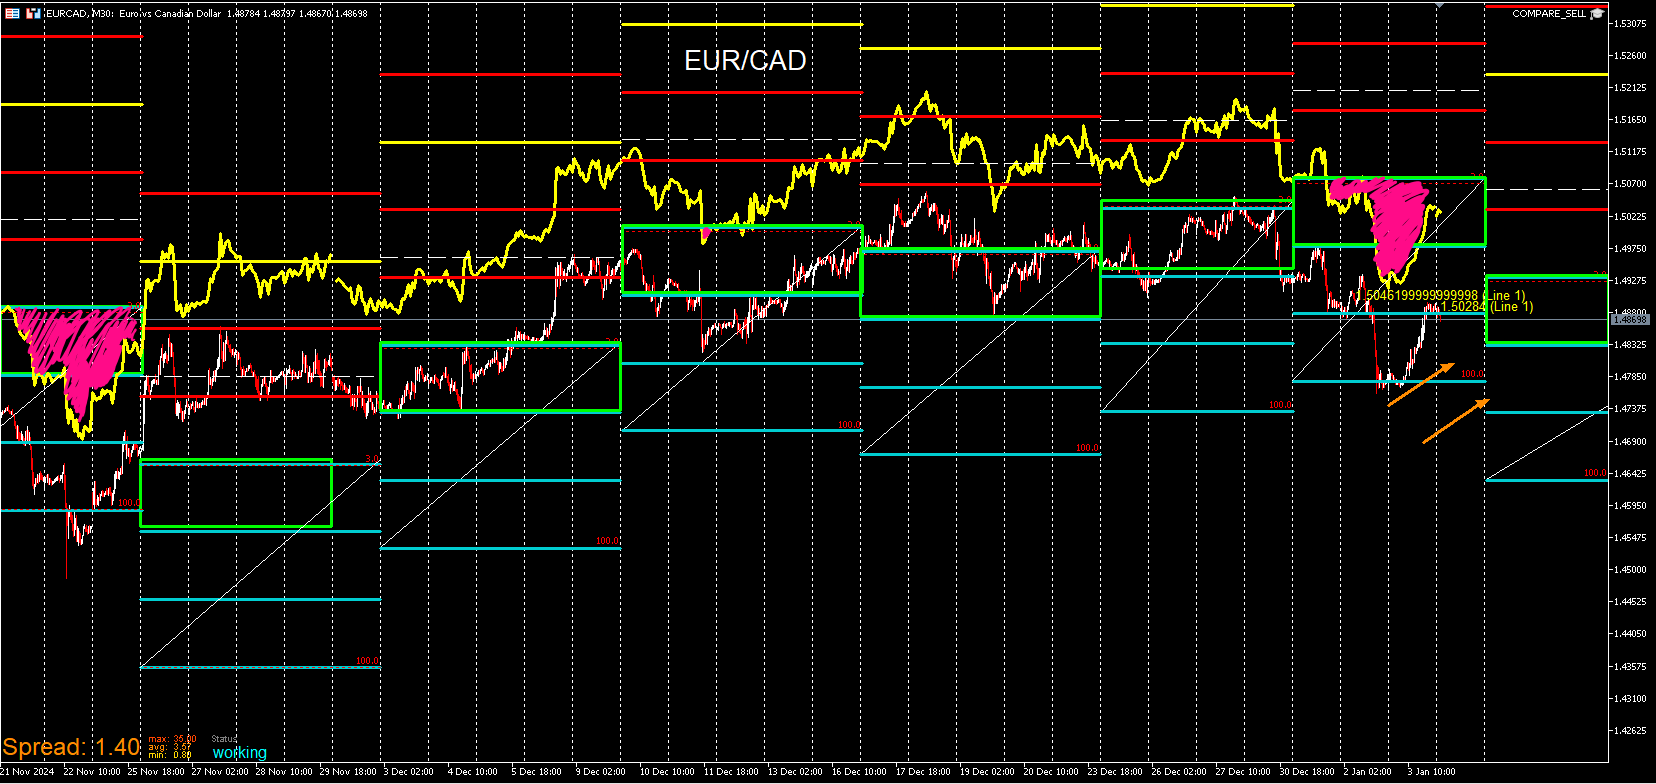
-
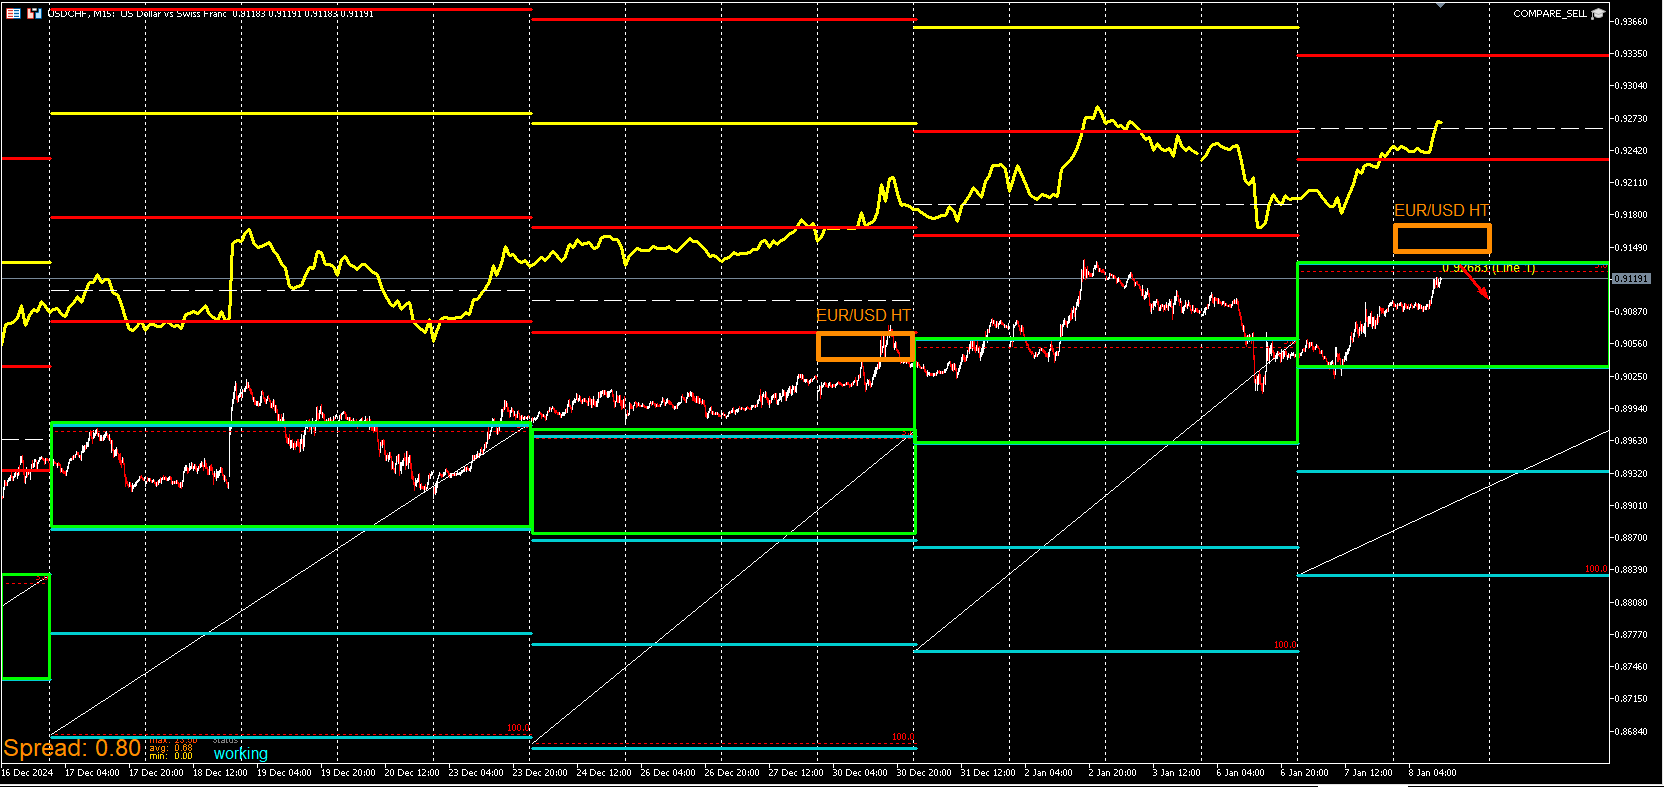
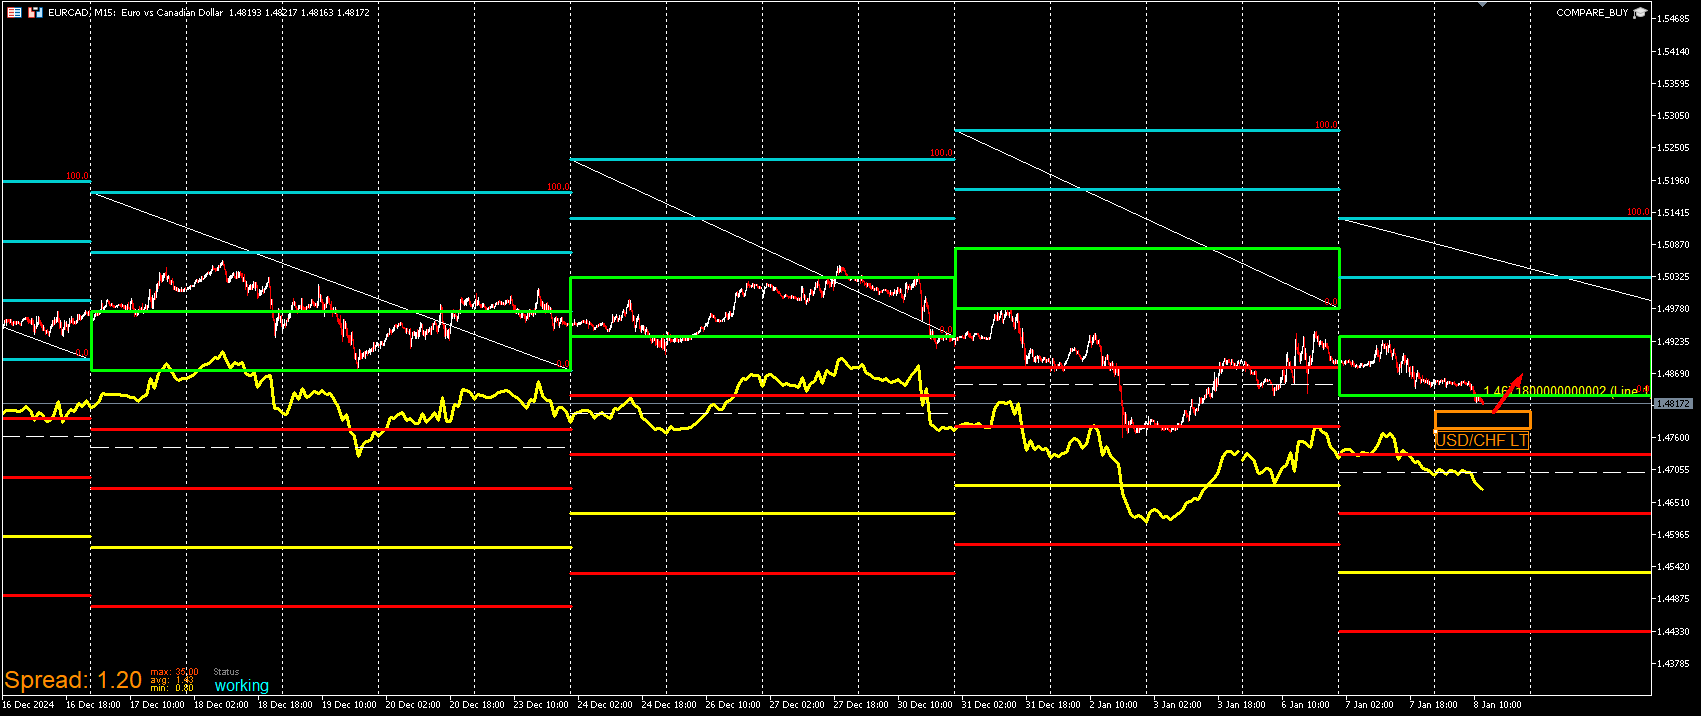
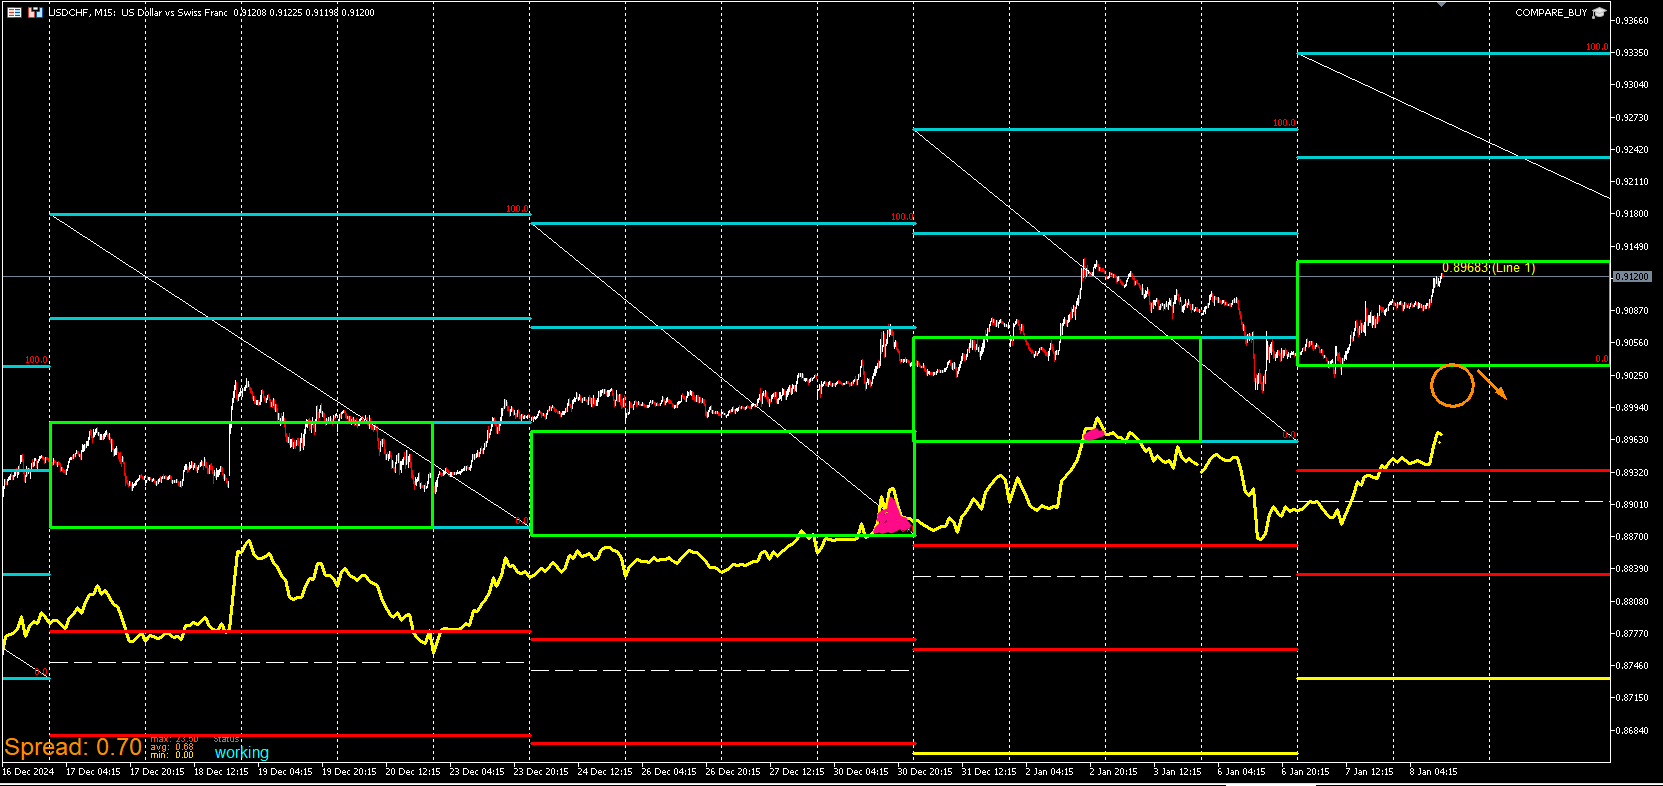
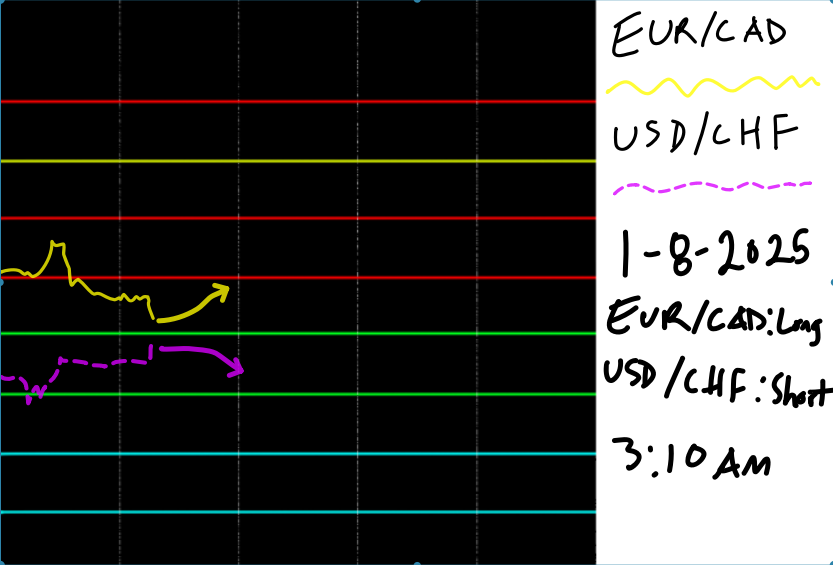
This post will go in depth on the last element of the Buy Compare and Sell Compare EA. I've spent quite a bit of time experimenting with scalp opportunities. I'm not able to catch them all because it's a ton of back and forth comparing pairs but I'll check into ways to automate it more down the road. Here is the basic idea of this template and why it has the term compare in it's name. I use these visual levels to compare negative correlating pairs to their respective levels. I will demonstrate this live since I'm not at work and can think this through and post this setup. This is a setup where I believe to be a high lowlihood of at least 30-50 pips. I'm not expecting price to rip or it to be a bottom for a while. I would prefer to identify these setups more compared to swings but I'm still testing this out. What I look for is the tracer for X pair to near the actual price of X negative correlating pair. For this example I'm using USD/CHF AND EUR/CAD. I enter on the idea that the these lines are likely to repel. It's not always the case but I've seen this pattern enough to assume that.That's actually the EUR/CAD box on the USD/CHF chart. Not EUR/USD. I forgot to change it.
USD/CHF
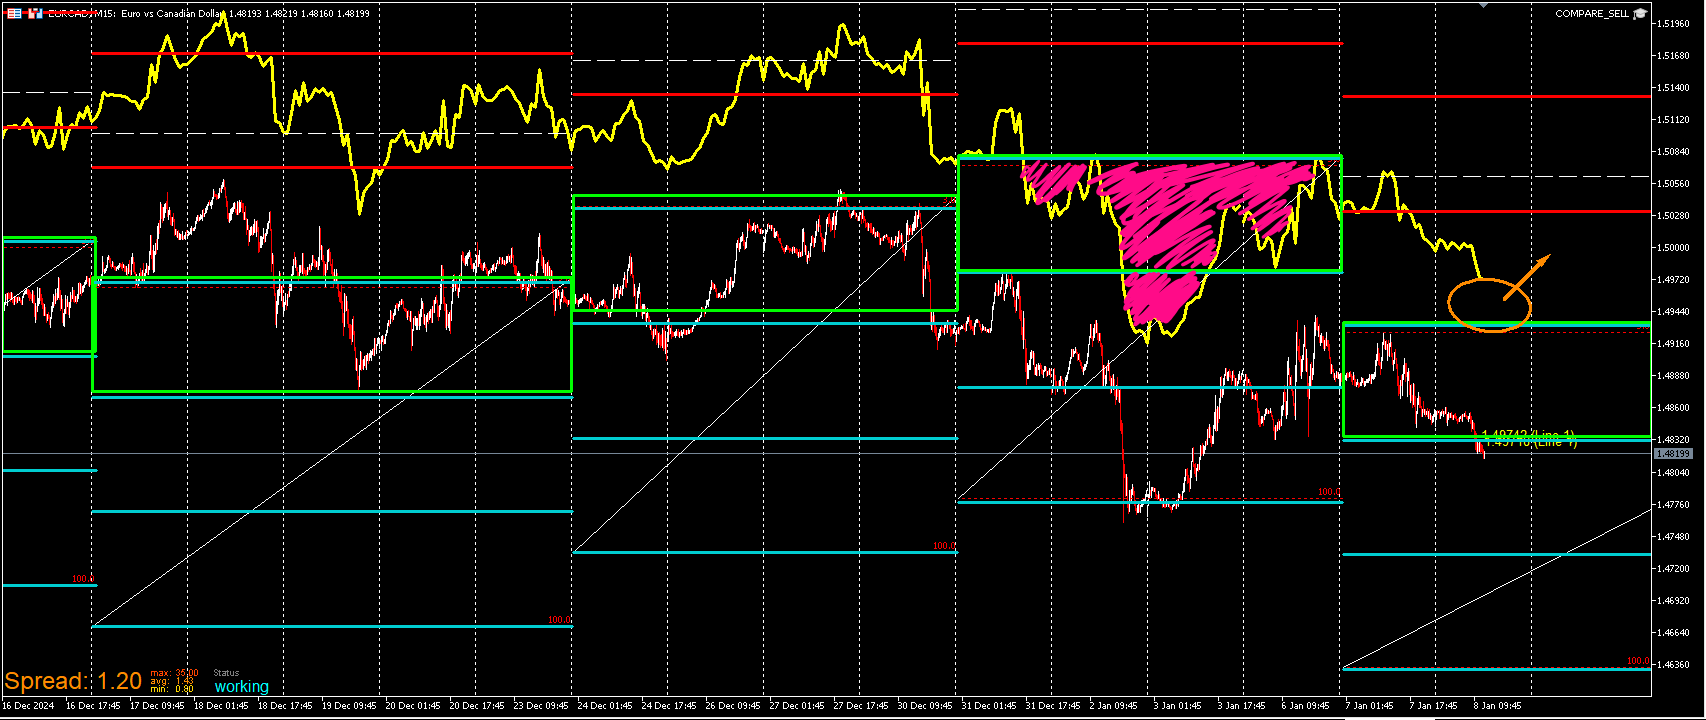
EUR/CAD
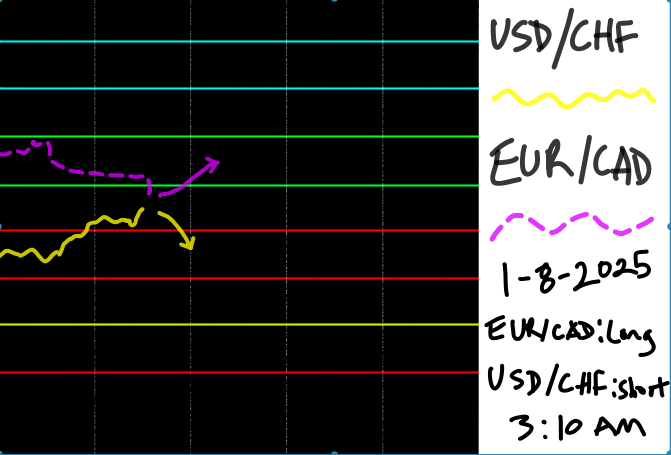
Here is a simplified graphic. These are flashcards of the idea using PureRef. They yellow line is the tracer of one pair. The purple dashed line is the price of the other within it's respective zones.
-
-
@JayPhillbrooks so does it auto trade or you pick the trades manually...?
-
It' 100% manual. I've experimented with automating trades but it's just too slow. I think it makes more sense to just build a long only or short only algo if price is assumed to go in either direction. My biggest struggle has always been getting those trendlines detected because they are shifted from specific times and it can be wonky identifying them and when it does, they stay valid longer than I need them but nevertheless no matter what I did it either slowed everything down or created another problem so I just stick to doing it manual and using it as a visual reference. I'm actually in the process of converting these to oscillators and the use of this program makes it so much easier to communicate the concepts, conditions, and parameters.
-
I will now demonstrate the indicator. I had to convert this into an indicator because the process would be too cumbersome for the average user of having to run the backtest, save the template, uploading the templates, and applying the EA. I also ran into issues of a power outage or wifi going down and the process would have to be started over. I was quite annoying so I decided to convert this into an indicator. It doesn't take orders anyway so it makes sense to be any indicator plus the fact that it's a purely visual tool. It being an EA really sped everything up and helped getting the point across.
I named it DmRO (Diametric Range Oscillator)
The idea of the term Diametric is that when two opposing forces come together, there is a repulsion. For this case of price. When the high positive tracer veers into the negative levels, the assumption is upside coming. Vice versa for the negative tracer into the positive levels.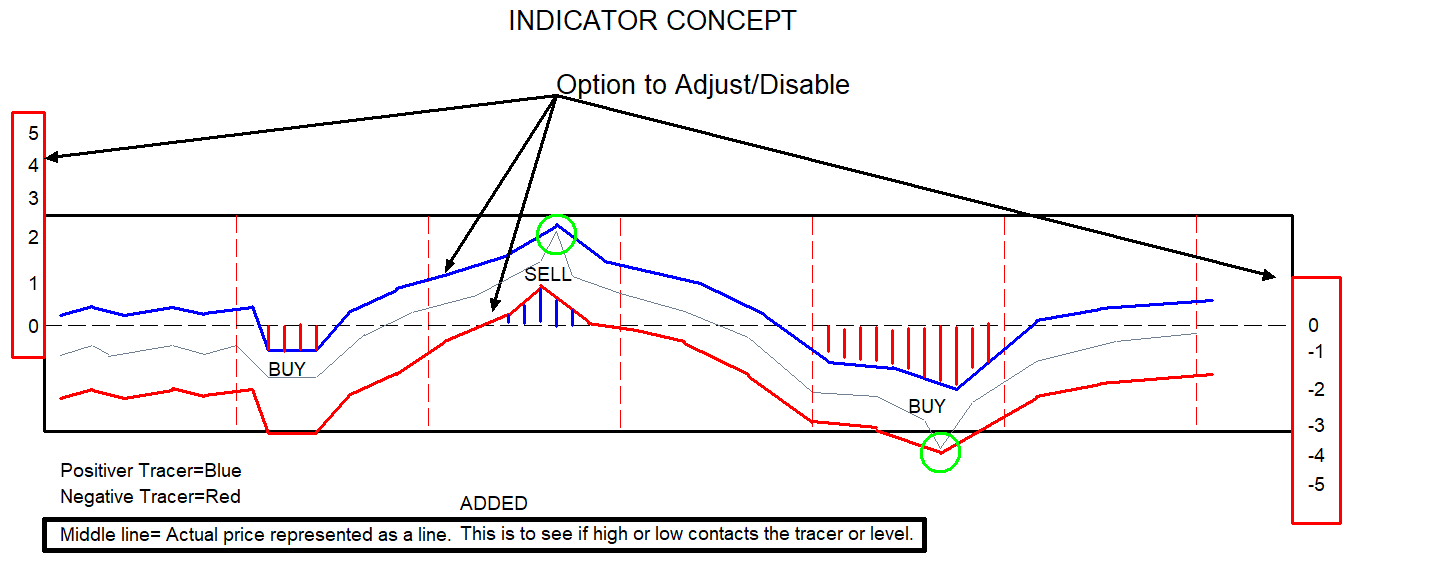
-
The concept is closer to a histogram style but the final product is not. But the idea is there. Here is an example. The strategy is applied to the default and every element can be either adjusted or disabled leaving room for much flexibility. By allowing so gives the user the ability to adjust it to stocks, indices, metals, etc. It will take some experimentation but as of now the default is set to currency pairs excluding exotics. The color and length of the lines can be shifted to help with visualization. Here is my preferred setting as of now. This setting for me is simple. I just need to see the blue positive tracer interact with the negative red levels that what I believe to be price to be going long. If I'm short another pair, I'm looking for the red negative tracer to interact with the blue positive levels. It matches up very closely with the templates I've been posting on this thread so I'm happy with it.
-
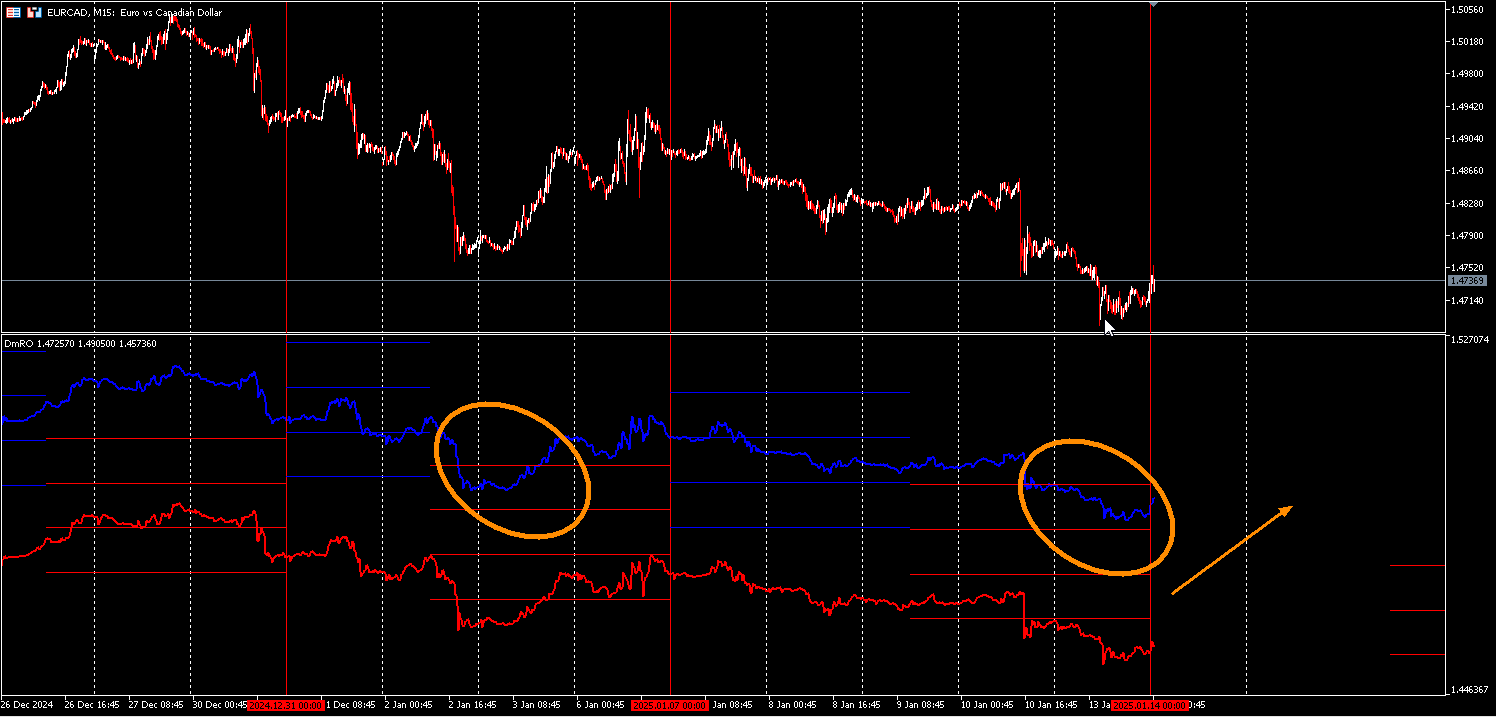
Another feature of the indicator is the option to add another currency for comparison. I like see both currencies at once to compare an overall direction. Just because both pairs are negative correlation, that does not mean that they move opposite all of the time. In some cases they do. Other cases one may be trending while the other is flat. Rarely they move together but when they do, I try to spot it. Moreso when they do for some time. I use to have to take a screenshot of both charts and combine them in photoshop. This cuts that tedious step out completely. The additional currency is displayed with thicker lines with its own tracers. Those tracers don't need to interact with the levels but I am experimenting with entering when they converge with the tracers of the other pair or the price line which is in the middle. I depends on whatever bias I'll have.
Here is a clear example. Not all pairs display perfectly for every pair but enough of them do for this to be useful. It really depends on the price ranges and volatility of the instrument. This works for indices and metals also.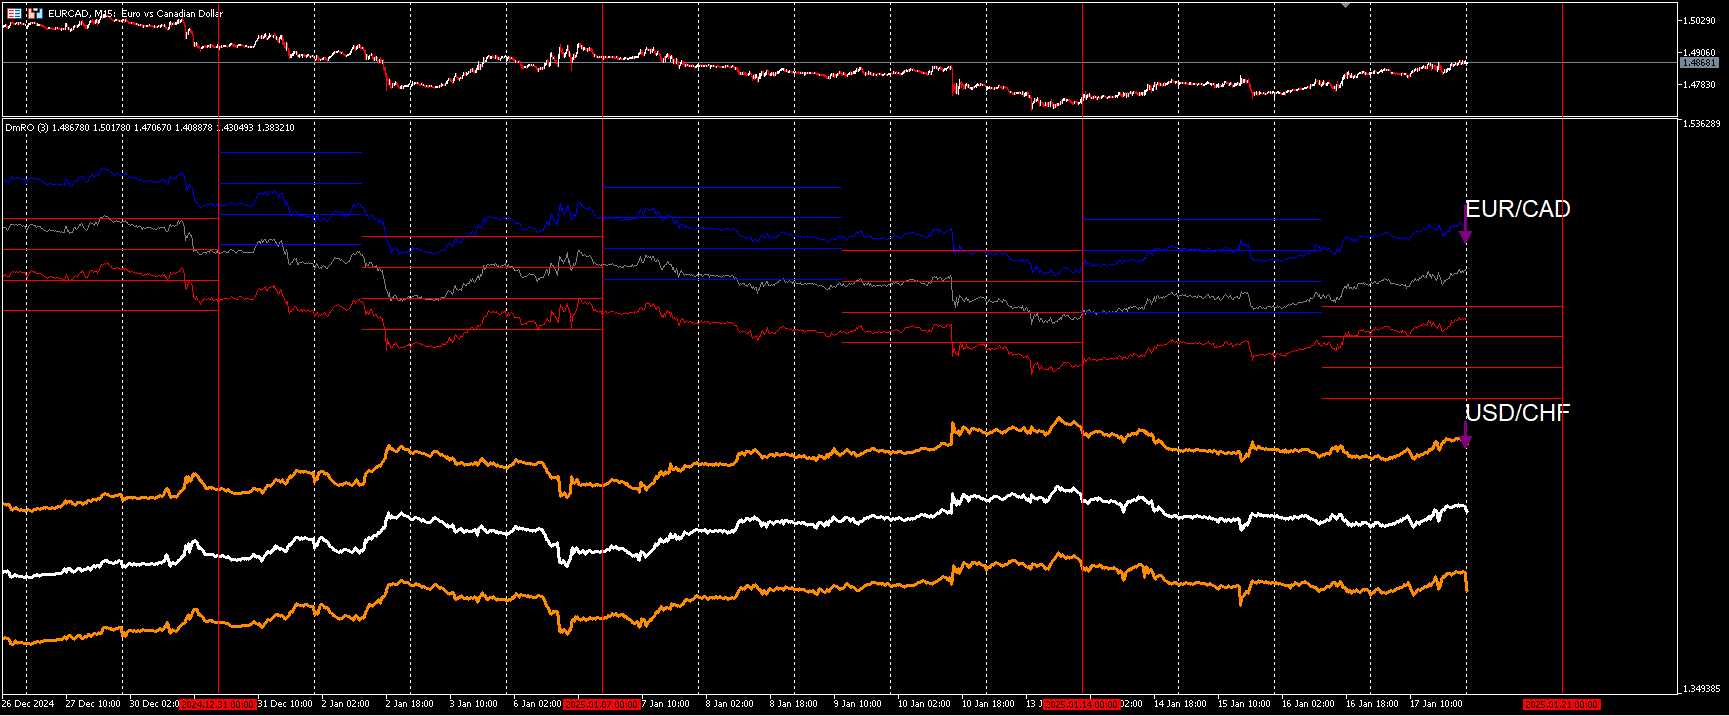
-
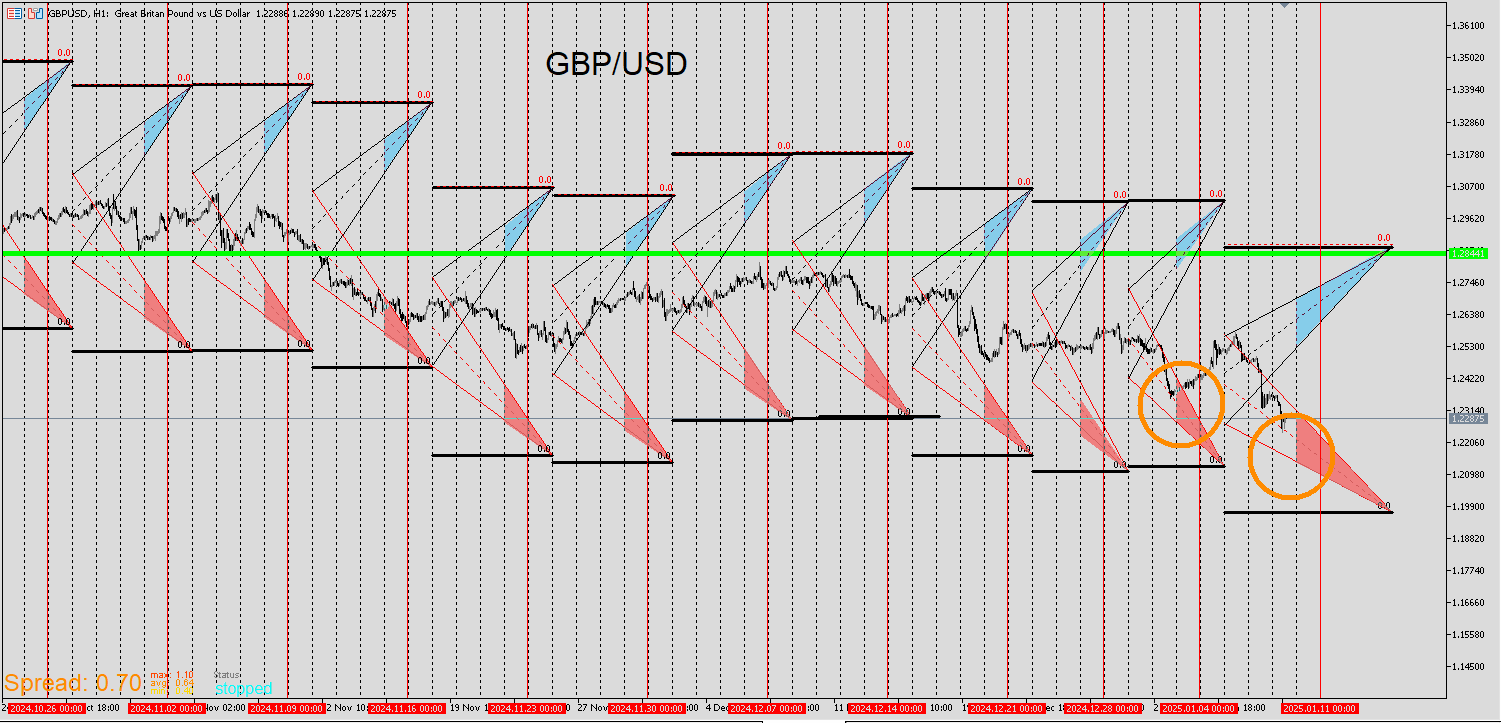
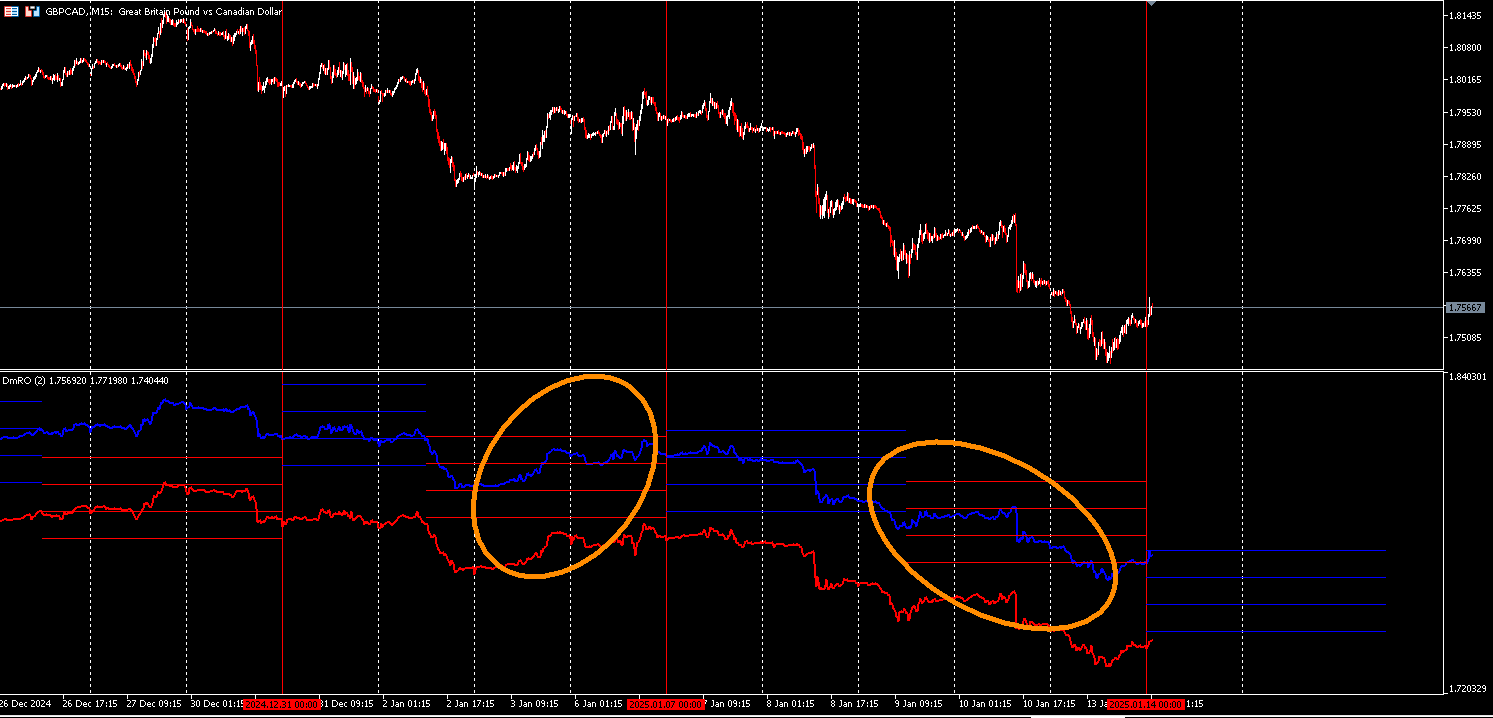
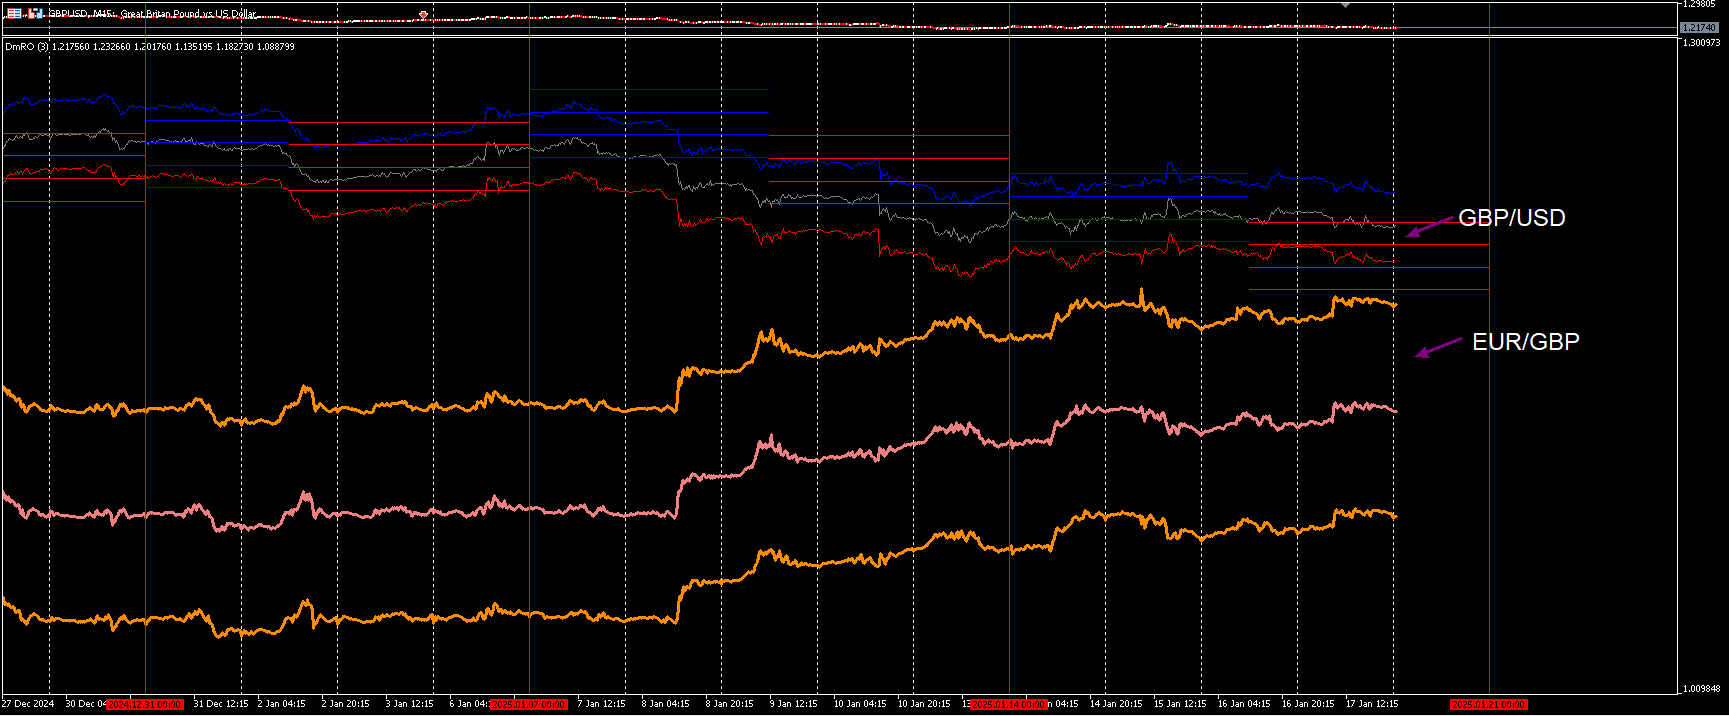
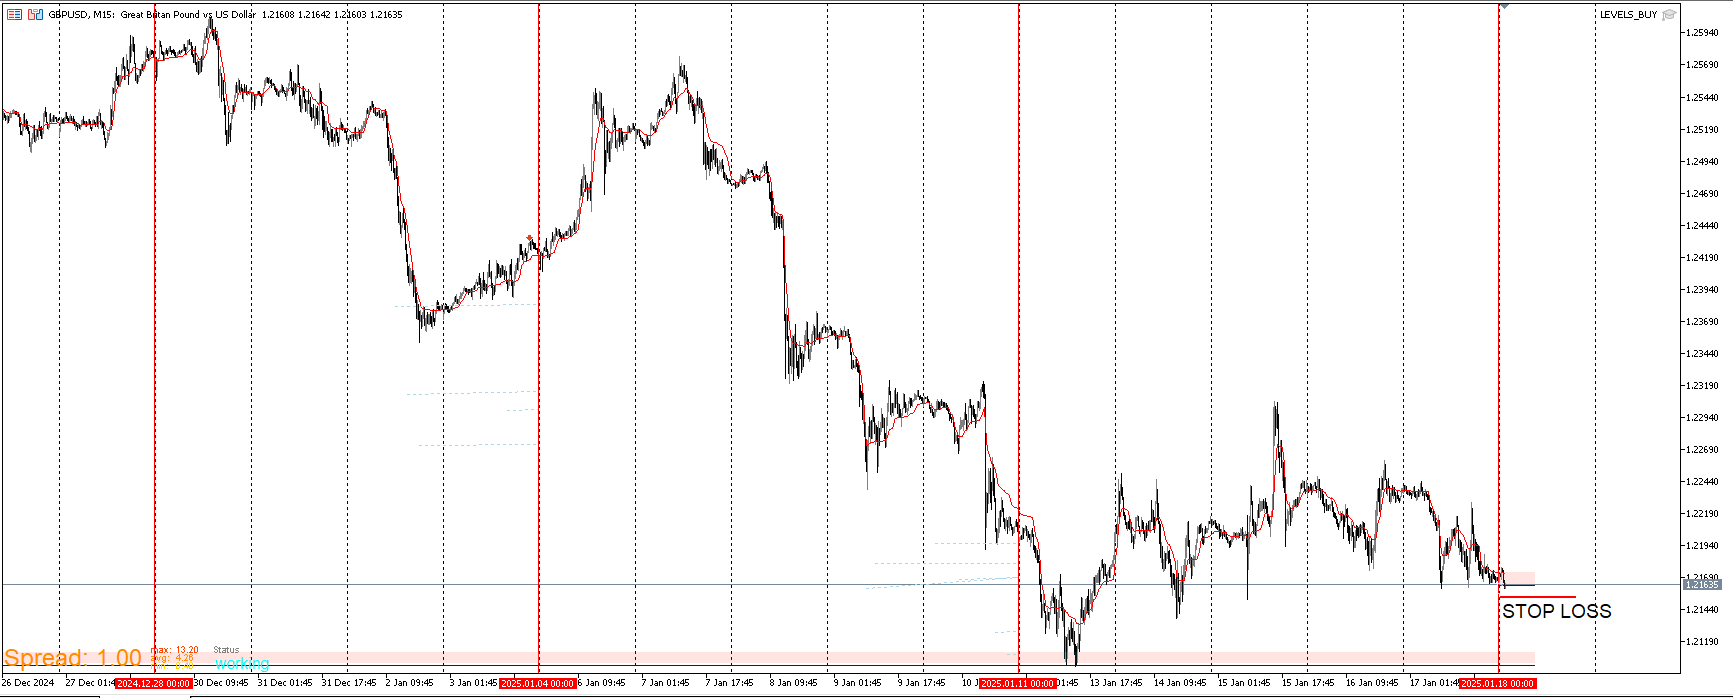
Here's another example. GBP/USD and EUR/GBP are strongly negatively correlated. My rules have been met to be long on GBP/USD I think for case the bottom tracer for GBP/USD and top tracer for EUR/GBP will repel and not make contact.. This is the first contact I look for. Some cases they do intersect. I'm already in the positions so I'll hold them. This is a theory based on past behavior of these lines. It's been a long time since these zones made contact and the longer, the better the likelihood.
-
Here is EUR/USD AND EUR/GBP comparison.
In this example both price lines are converging. This is another entry opportunity. I'm already long EUR/USD and this is my confirmation to stay in. I keep my positions really small and will add if these hold up.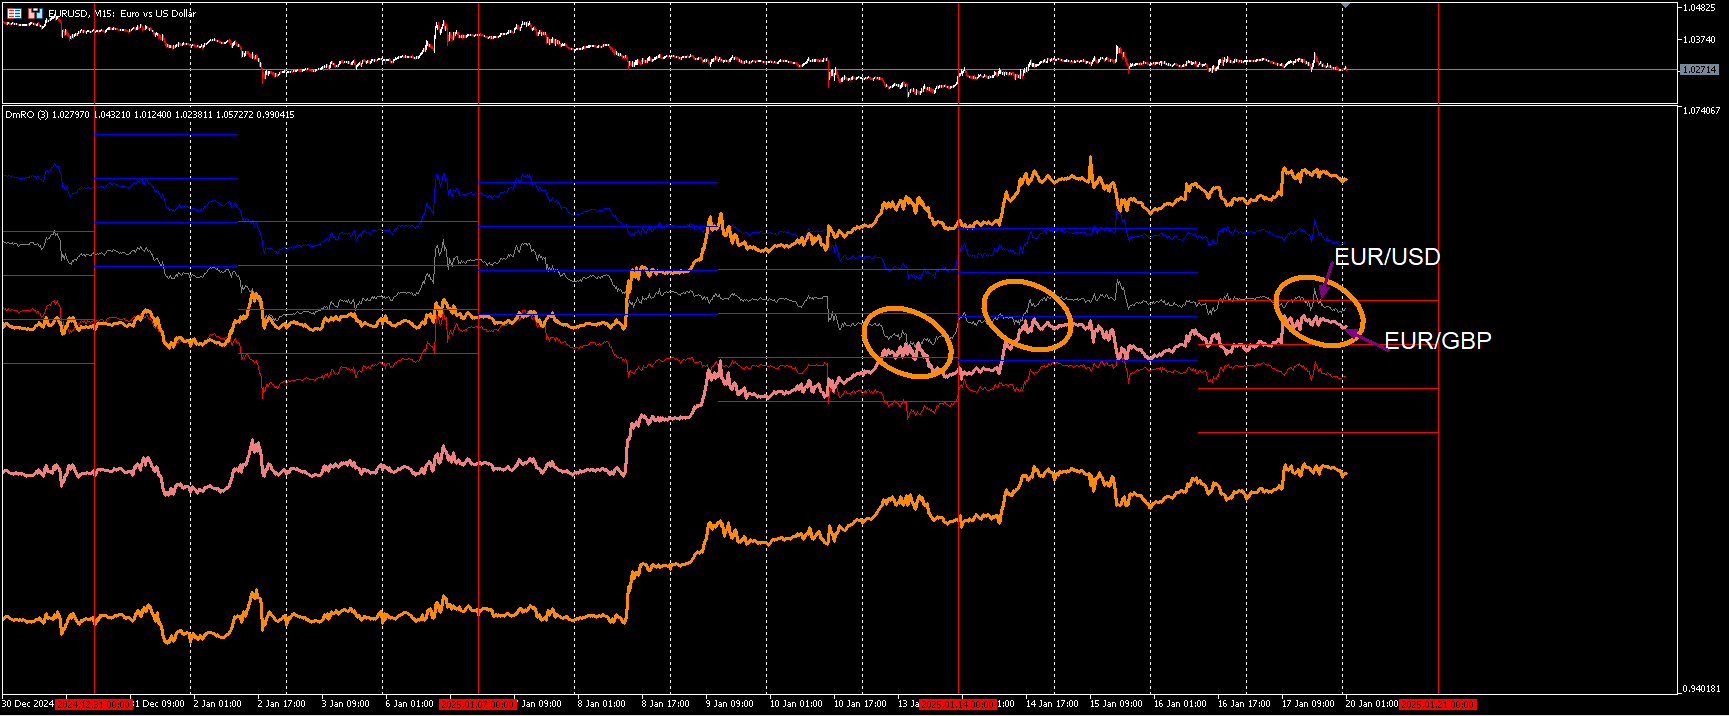
-
I put an entry on for EUR/USD using the BCC template. When my thesis is long, I buy at these levels with the stop loss tight. It's low risk and if I get stopped out it's no big deal.
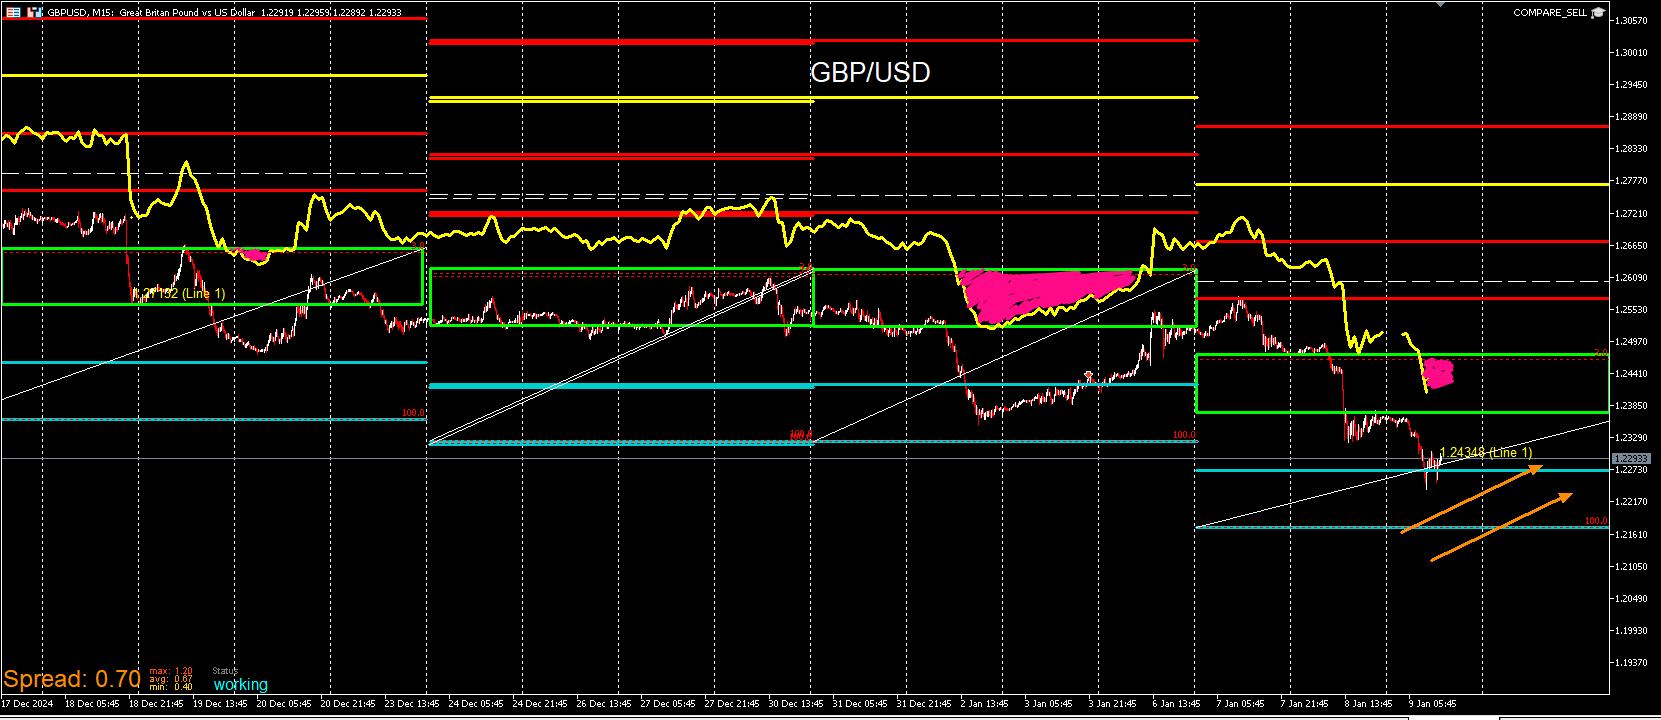
GBP/USD ENTRY
-
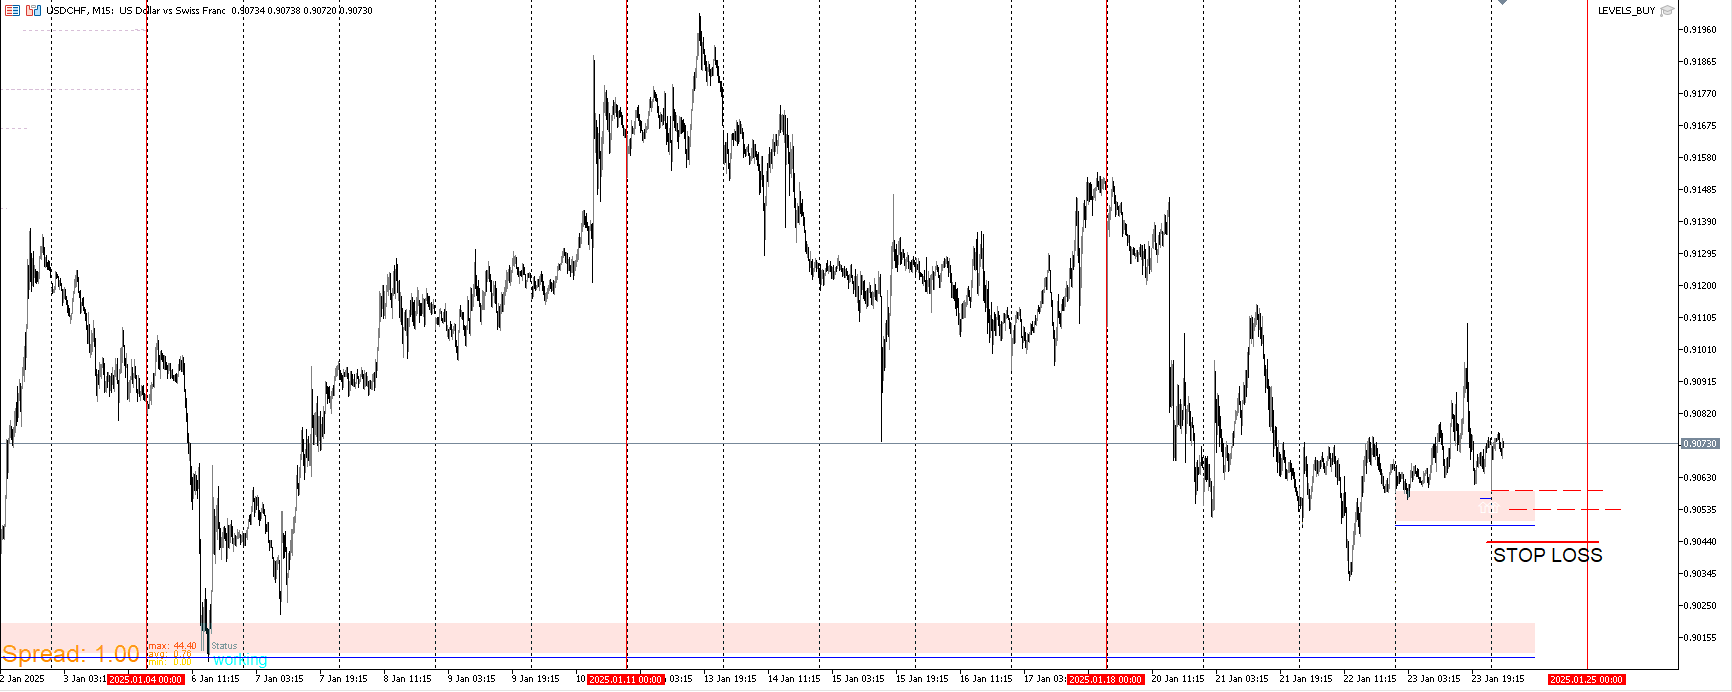
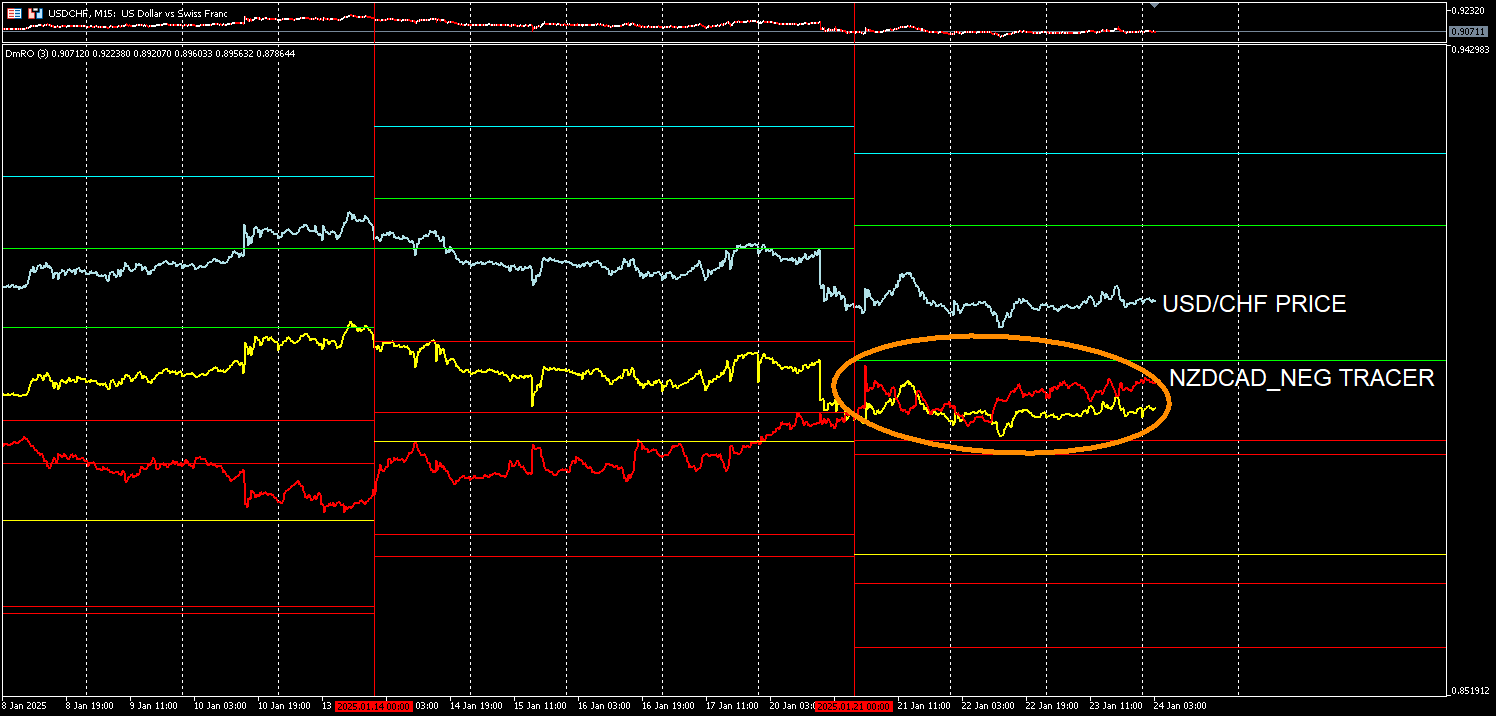
This post is to demonstrate the flexibility with the indicator. Every element can be adjusted and my settings are adjusted to my exact strategy and how I analyze currencies. I aimed to get the additional currency pair to be a 1:1 match to line up with the levels of the default currency. It wasn't possible due to price difference with some being much larger than others. A way around that is to disable the price for the additional currency pair along with one of the tracers for it. The remaining tracer is adjust to to the levels to match it's interaction with them. Now I'm able to compare the price of once currency to the the tracer of another and look for a reaction. The relevancy of this starts at the beginning of Tuesday and end the following Monday. So every week before the current week isn't aligned correctly. Only the current week is adjusted to scale. In this example I'm looking for a long opportunity for USD/CHF. Yes EUR/USD along with similar pairs to it have been moving up ever since my previous post but that doesn't mean that they will keep rising. I think there's still opportunities to be spotted in other pairs. They may be short term but if it's showing me something, I will take it.
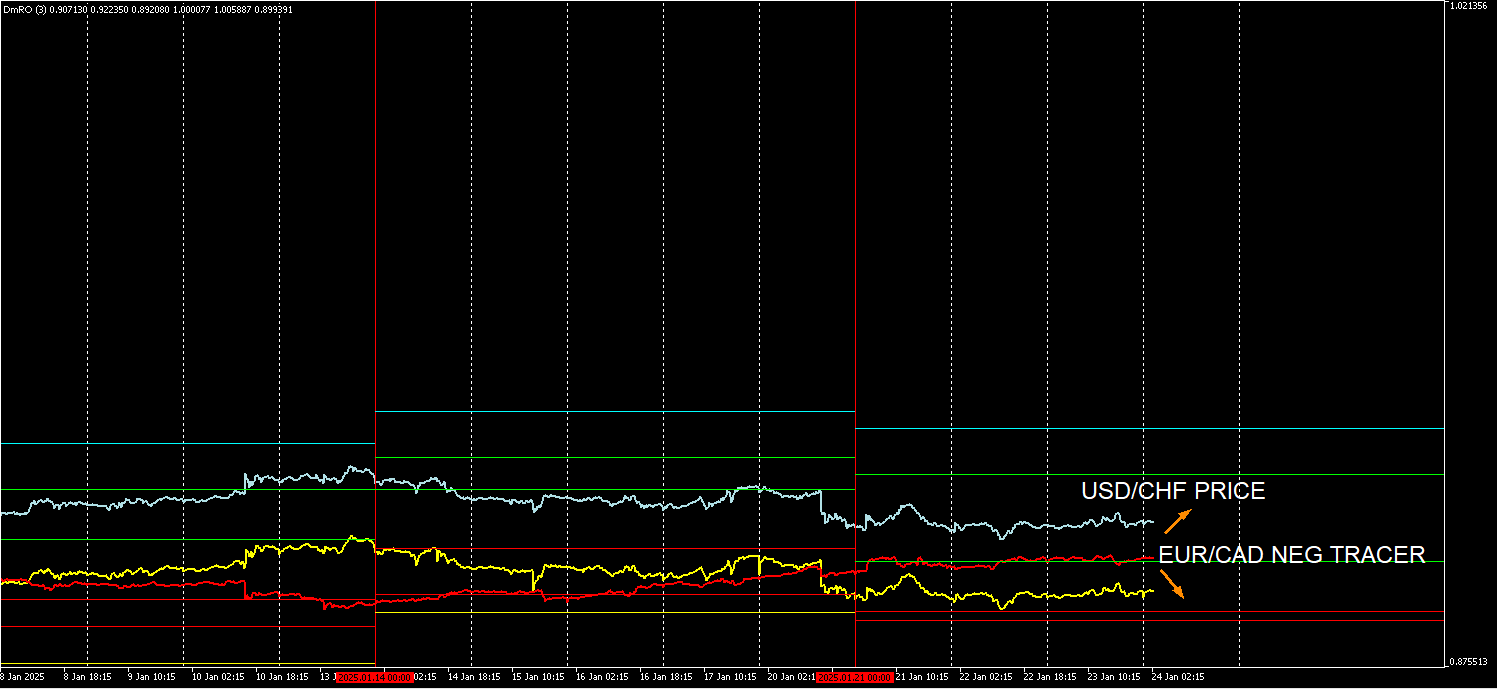
I will be utilizing the BCC Template again. These are the level I'd want to buy from if price gets to them soon. I have pendings of small positions on. If price gets to these levels and they they remain in place after the closing, I'll add and put the stop just below them.
I also compared it to NZD/CAD.I leave the yellow tracer on to see its relationship with the red one. It's not usual for these tracers to be close together for opposite correlating pairs. At least not for an extended period of time. It's usually short lived when they do. A complete cross and continuation is possible but here I expect a fanning out.
-
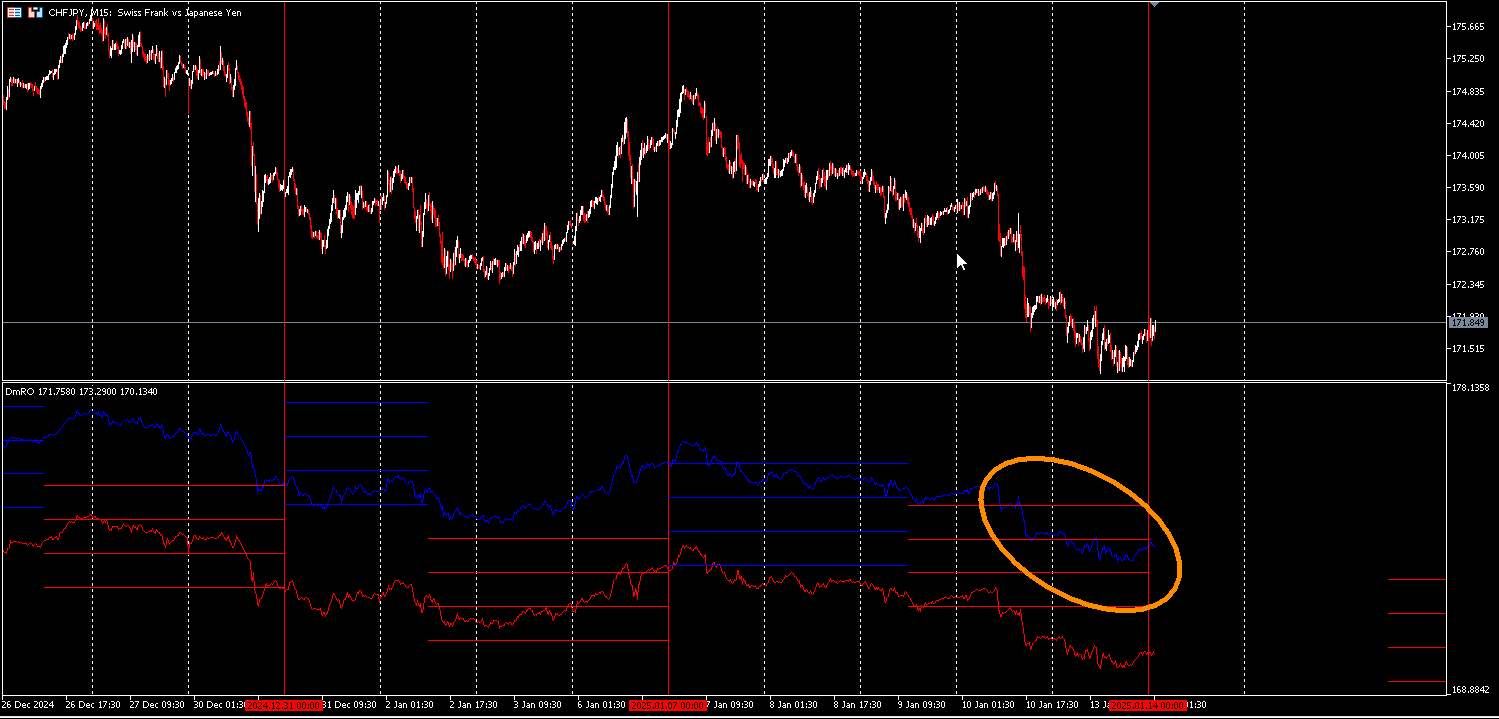
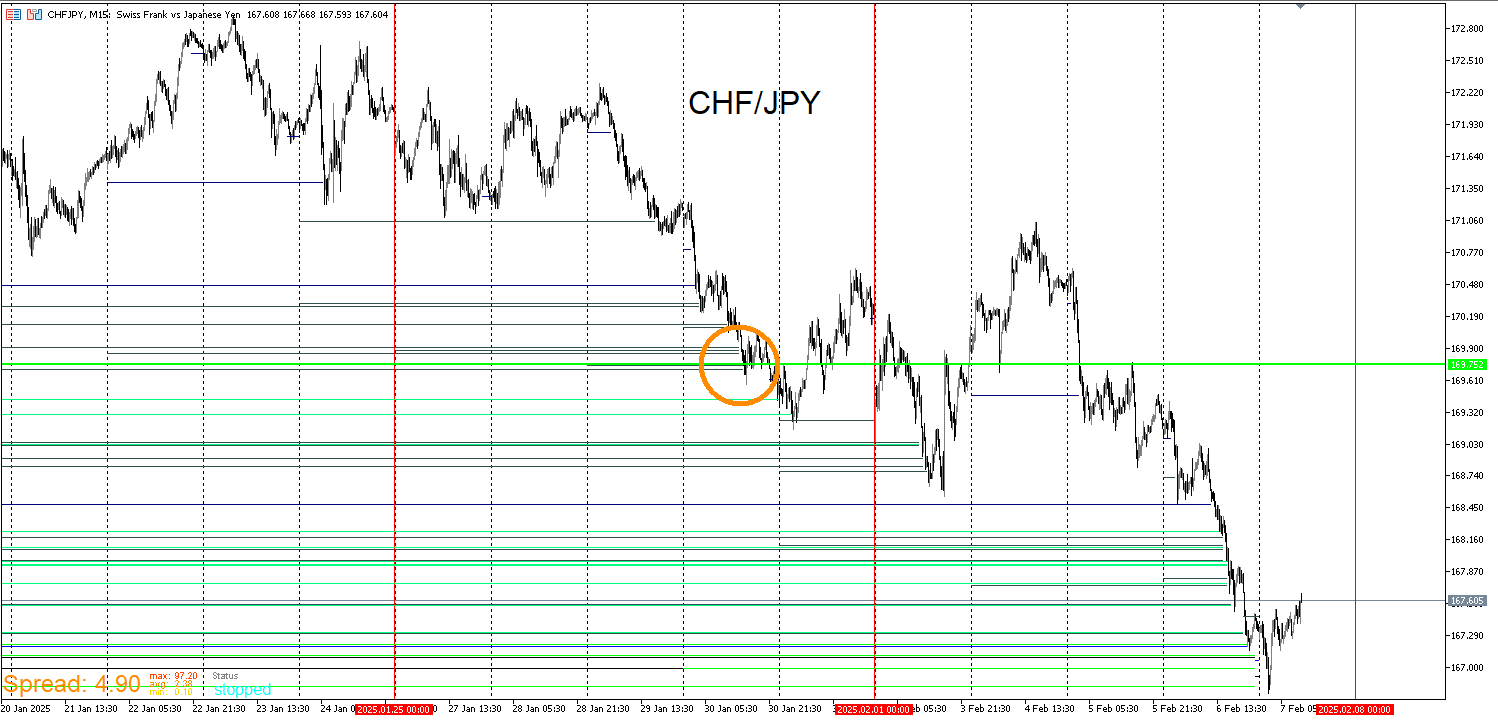
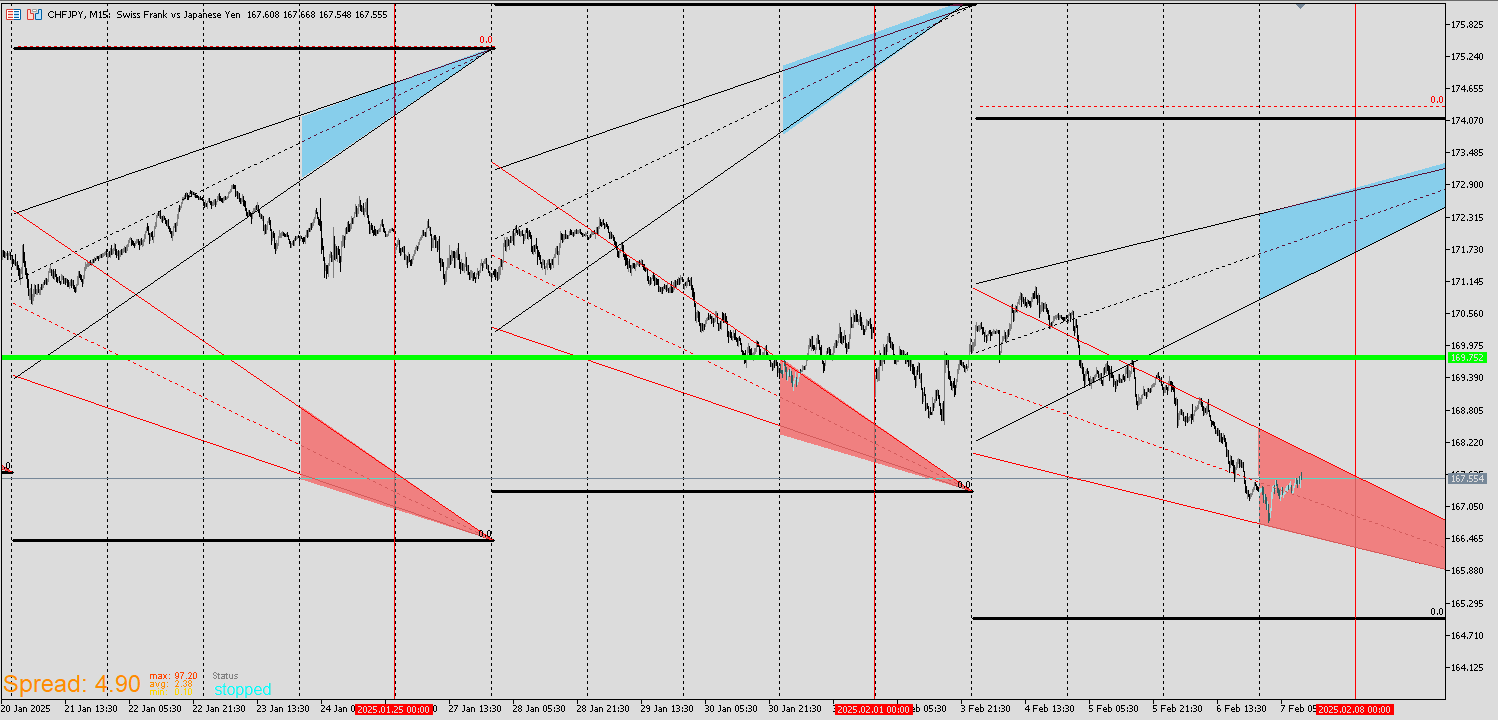
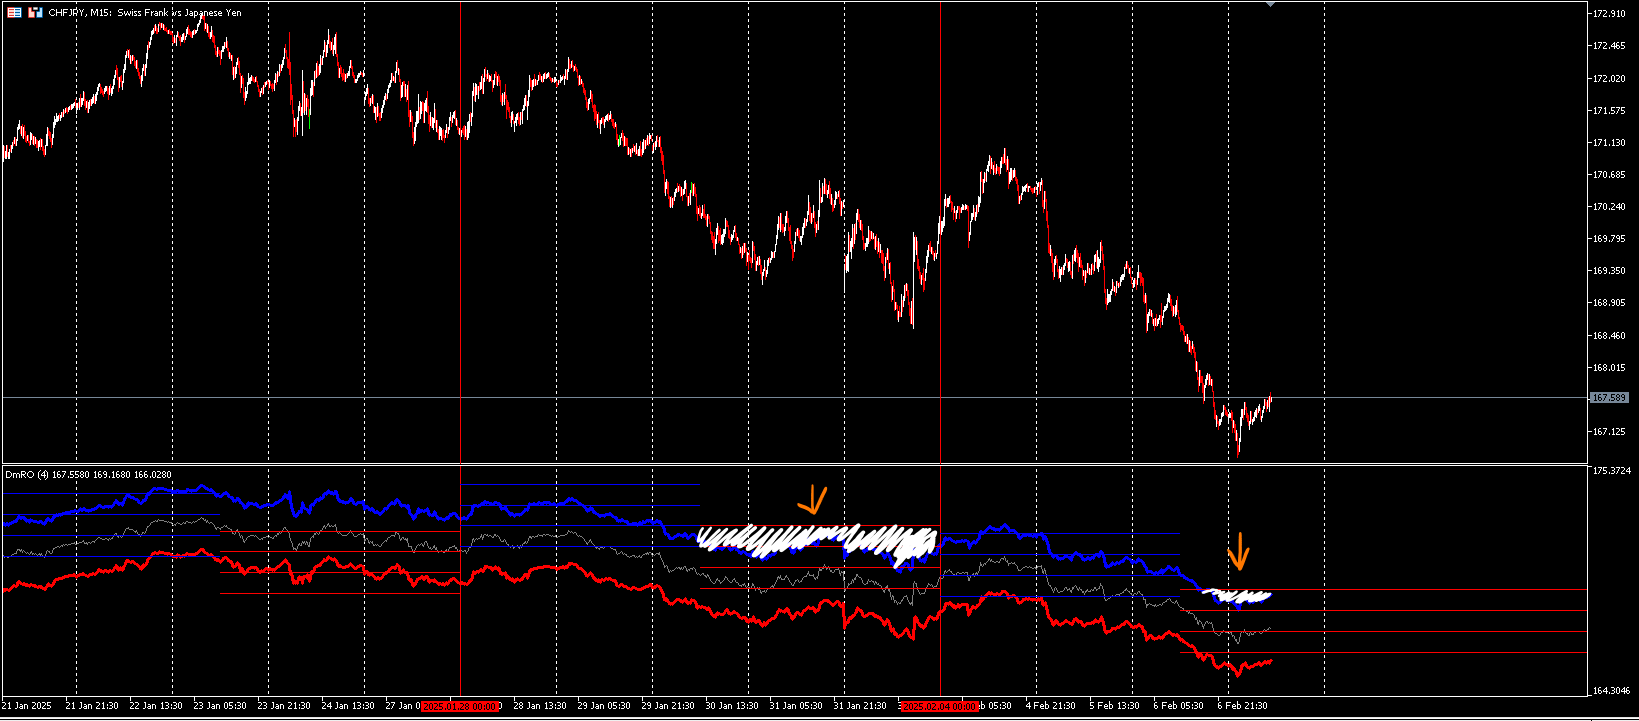
I'm still testing things out and finalizing the indicator. I will share a trade entry and the bread and butter setup that I will use once these opportunities present themselves every few months. CHF/JPY is setting up from what I believe to be a long. It's nearing the bottom wall and based on the backtesting going back to 2018, whenever this happens for this pair, there is usually upside that follows. More times than not. When this does happen, it's every 3-6 months. Nothing is guaranteed with the markets but those who are serious think in terms of probabilities. I will use just a small number of the concepts that I been using to enter this.
Wall
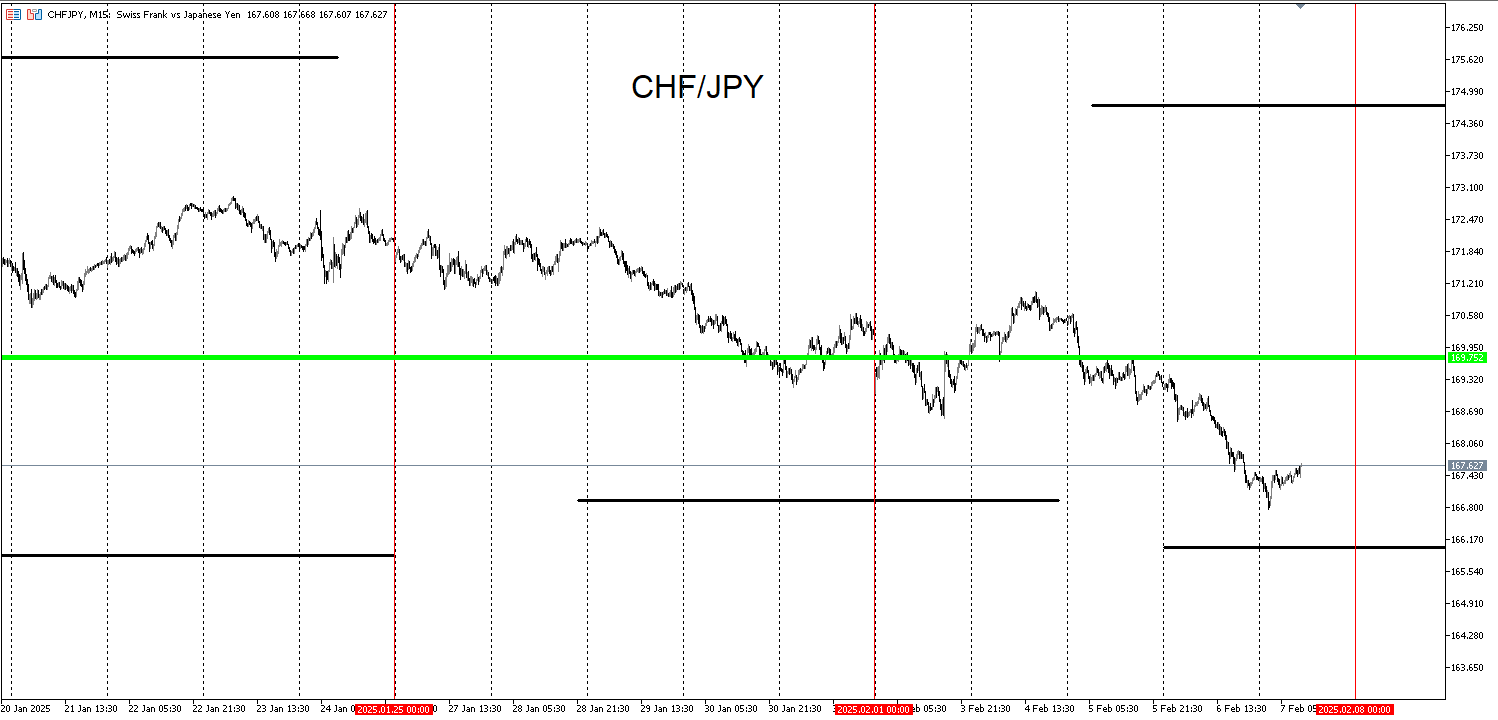
Green Line
Ribbon
DmRO Indicator (Blue positive tracers crossing into Red negative levels.)
-
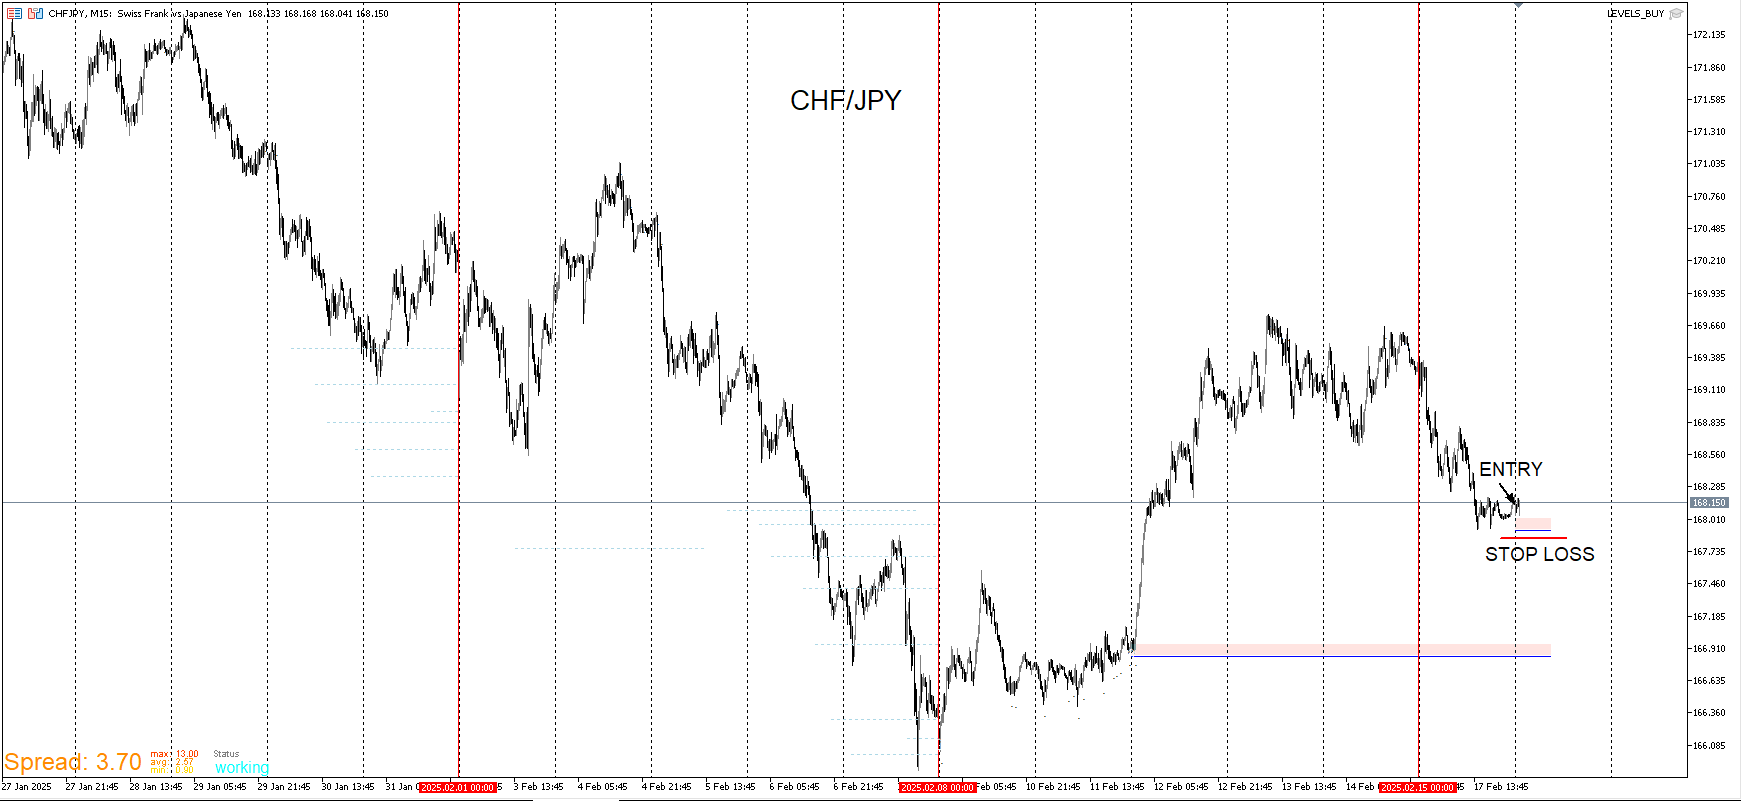
CHF/JPY LOW RISK ENTRY
-
Still long on Yen pairs based on Ribbon templates.


-
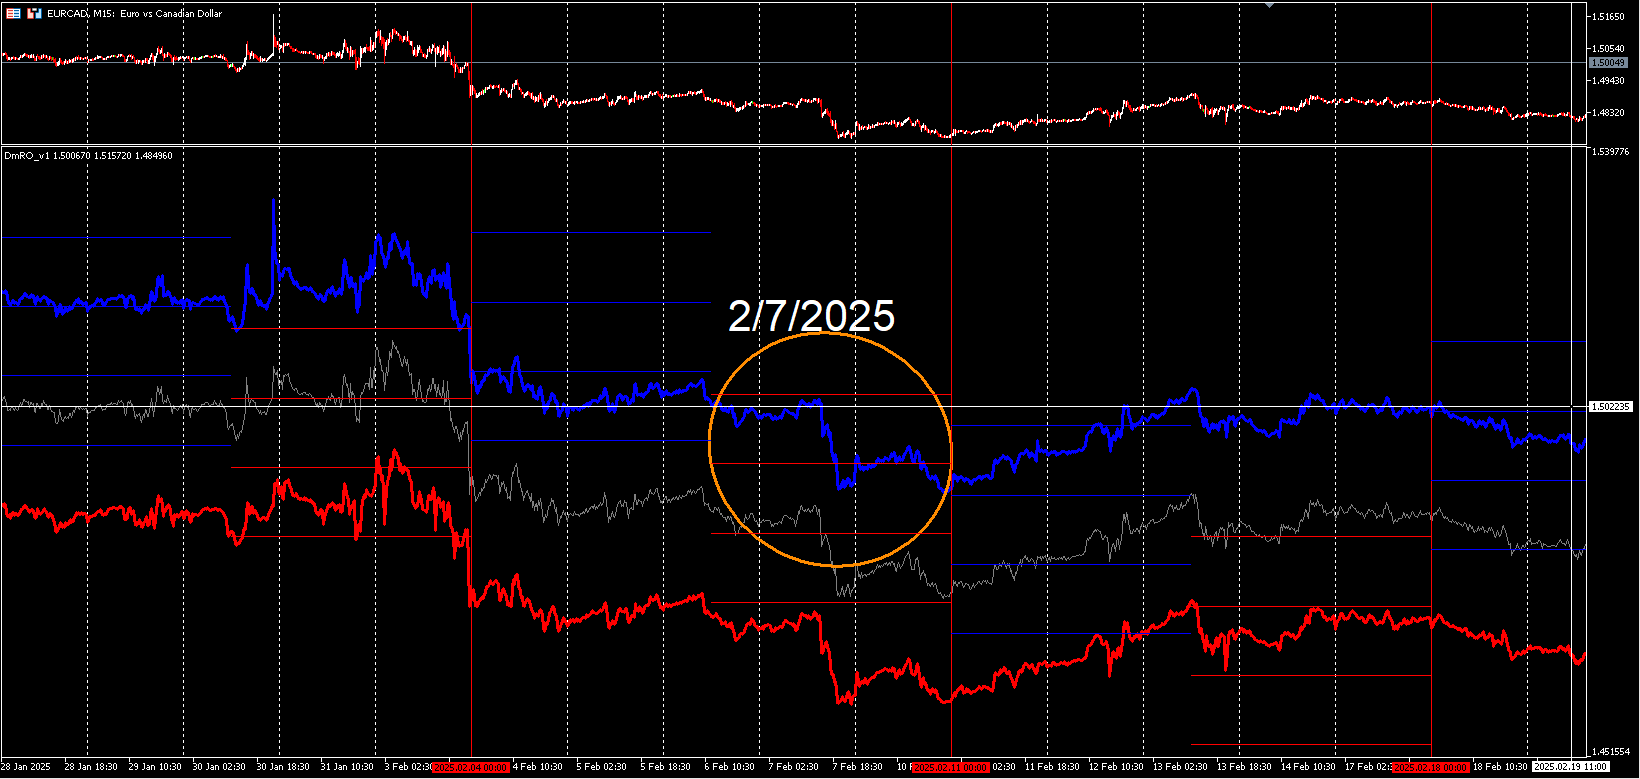
I will now share the results from my past predictions and entries. I aim to give it some time before updating because the bigger moves take time to mature. On 11/22 there were some pairs that aggressively pushed down. The one that I paid specific attention to was EUR/CAD because I believed that one to be the one to move up the most for the following months. The idea was to enter on pullbacks. Pullbacks are very subjective and there aren't any public tools that are reliable enough to properly identify them and to do so consistently. I used my DmRO indicator to identify an optimal time to enter.
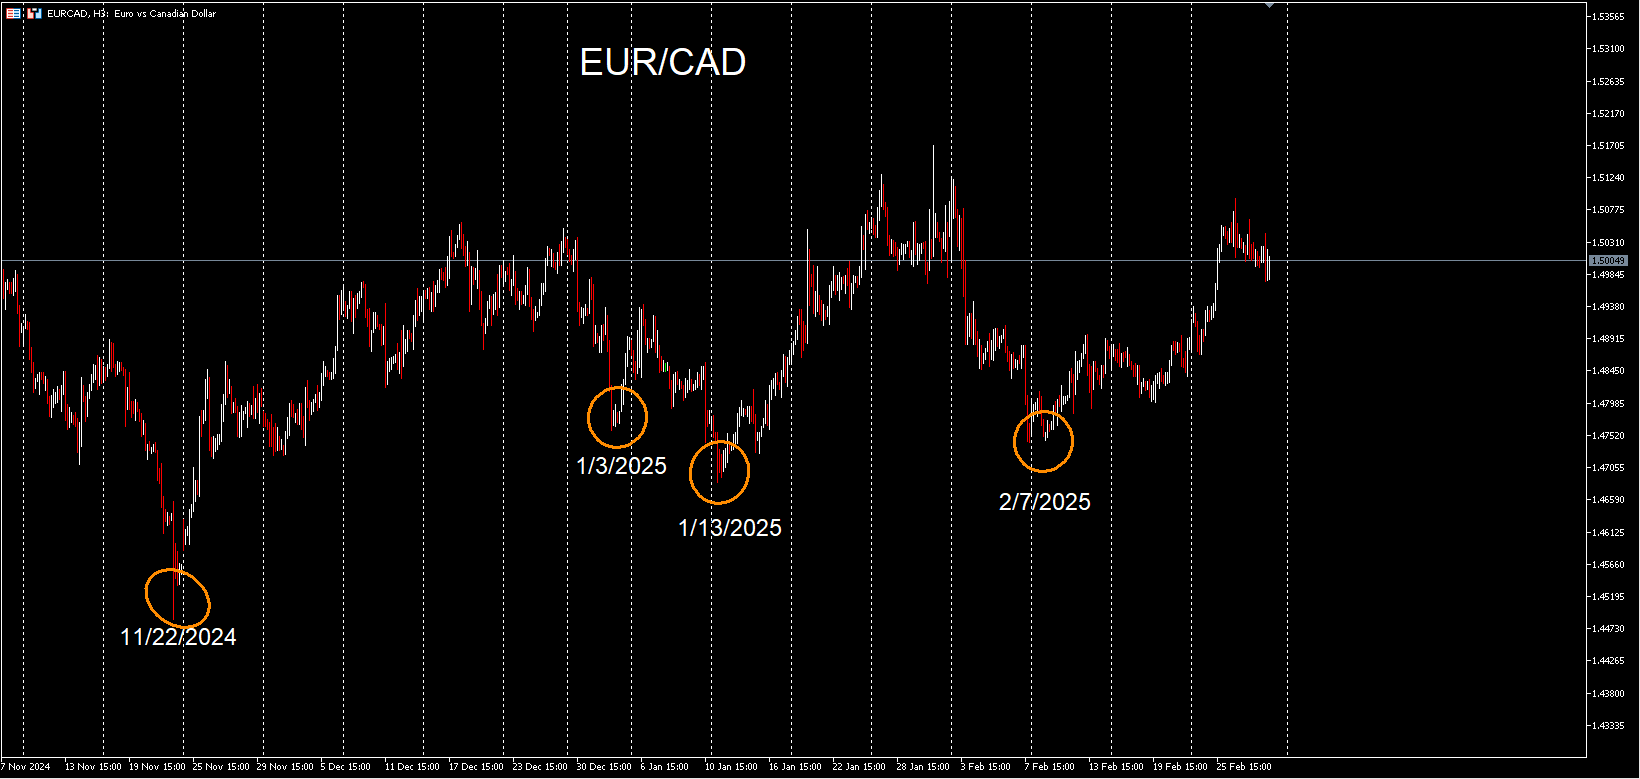
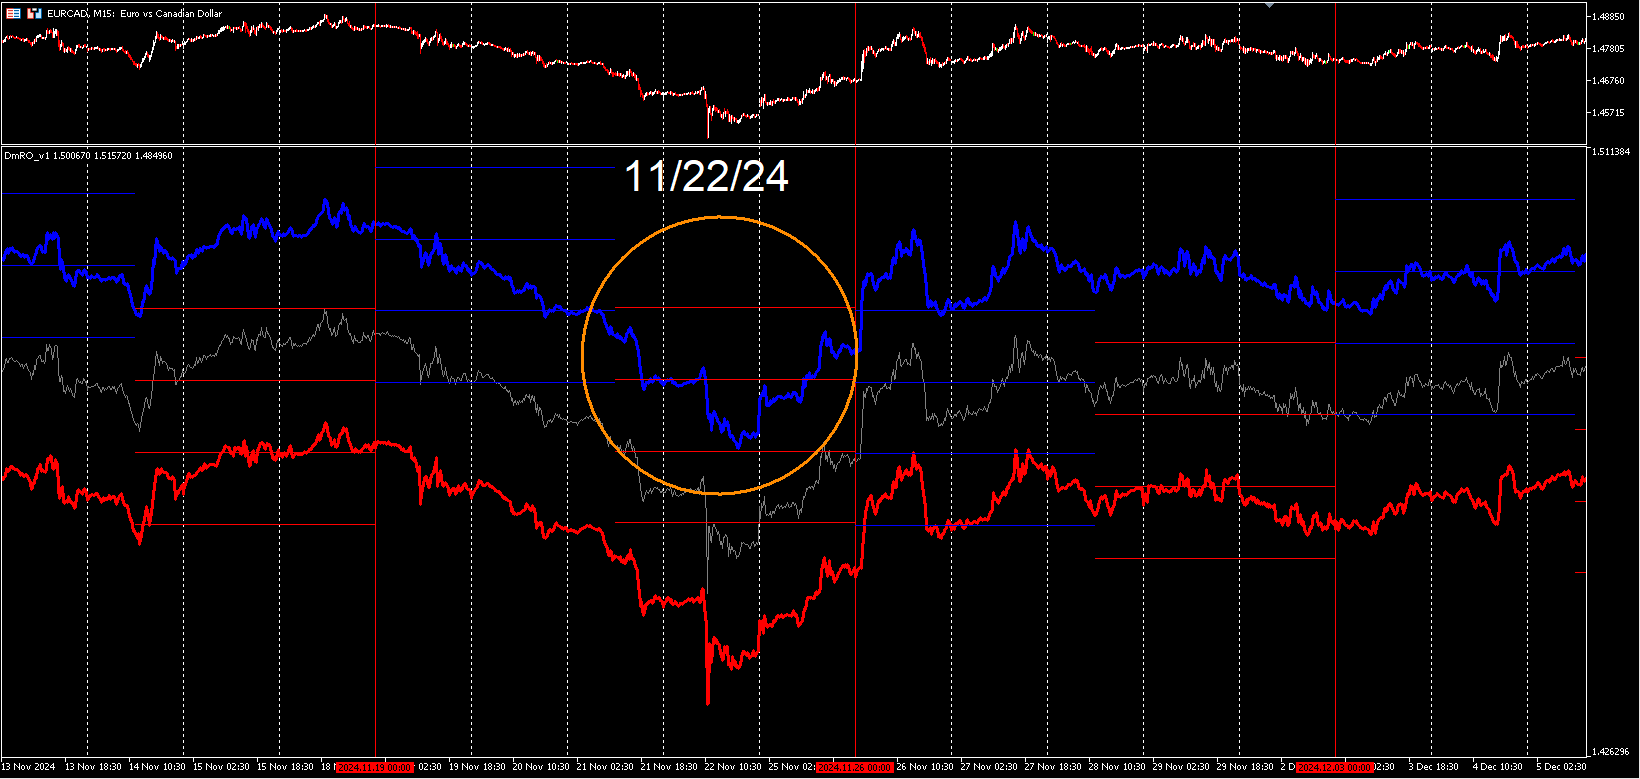
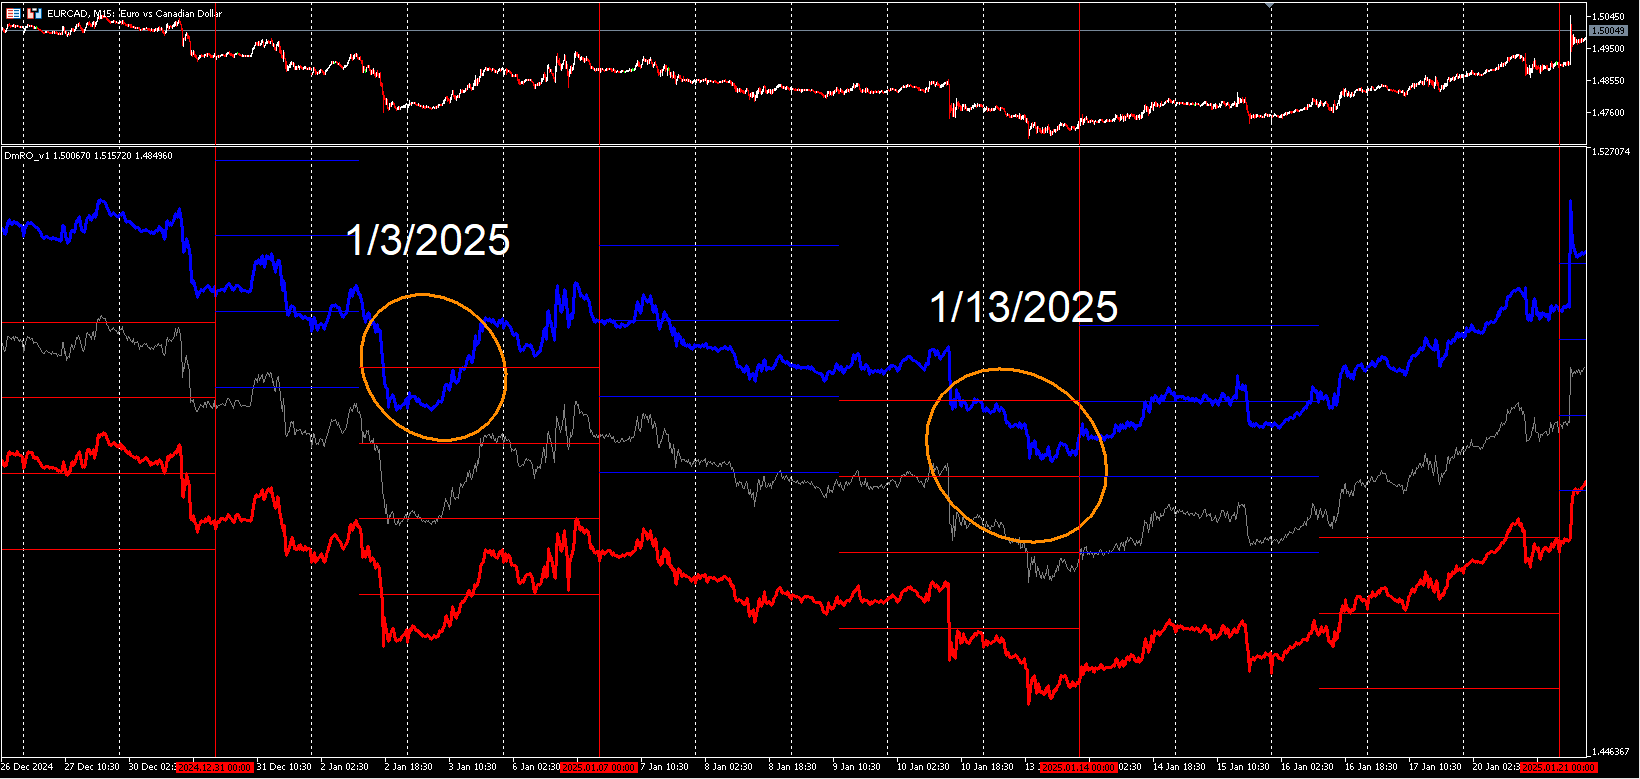
I didn't make a prediction on the one but it's the same pattern.
-
The entry for EUR/USD did move up quite a bit given how tight the stop was. I moved it to break even and only do so when price moves up substantially. Unfortunately it was taken out by a huge gap which rarely happens but that part of the game. I'm assuming that was fundamental due to all the tariff stuff with Canada because USD/CAD gapped up. I was still safe on that move due to the level I got in on and that's why I don't buy as price is climbing or is at highs. I also don't enter during or after gaps. Especially when I'm not at my computer to analyze what's happening. I'll find another entry if one presents.