object label
-
How can I get the label of objects adjacent to them on the chart?
-
try something like this:
but it can be different from your project, so better if you post here more specified what you need, some picture as example ...
-
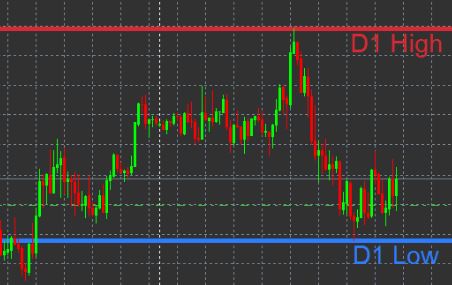
I want to have the label visible on the chart. Sometimes I have many different objects and I want to know what is what...
-
and when you create this label in the same time when object is created? (I mean, create object and after that create label in the same price as object was created), so both in one time ...
-
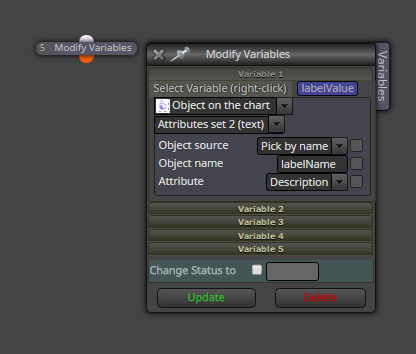
...yes at the same time. For example when a trendline is created I go to the properties--> name---> "LowerTrendline"
I want the LowerTrendline to appear with the trandline on the chart and moves with it when I move the line...... -
this behavior is not so easy to automate ... it is possible but it need a lot of custom code - and this means a lot of time to do it
 .... maybe somebody help you here how to do it easy but I dont know .... in future I try something ...
 -
Horizontal lines are just lines, they don't have such label that comes with them. These labels are different kind of objects. It's not impossible to create labels and move them with the lines, but this does not exist in fxDreema... at least not in one block.
How this can be done... at least on theory - It is possible to catch the event of moving any object (event like this would happen very often, multiple times per second depending on the speed of moving your mouse). In that event I imagine that the name of the horizontal line can be read and with that name the label with similar name could be found. Then the idea is to move the label at certain distance from the line.
And I'm only speculating on this, because I'm not even sure that you can do something like this at all. Now that I'm thinking more, I know 2 types of text objects that can be printed on the chart:
- One of them can be positioned absolutely - at certain pixels from the top and the left. In MetaTrader this is the T icon. But this object does not move with the chart! While the horizontal line does.
- The other can be positioned vertically on certain price and horizontally on certain time (candle). Basically the same way that any arrow is positioned. But what is the time (candle) at the right side of the screen where normally you don't even see candles?