Trendline settings
-
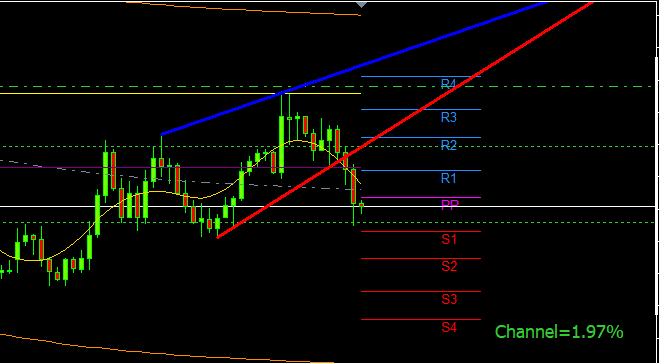
Could someone please help me understand how these settings in my trend line condition should be setup to match the picture?
My shared link https://fxdreema.com/shared/IuykC4Tmc
What I need is settings according to this picture:
And here is the Indicator:
0_1647364536420_Autotrendlines 3.mq5Thank you
-
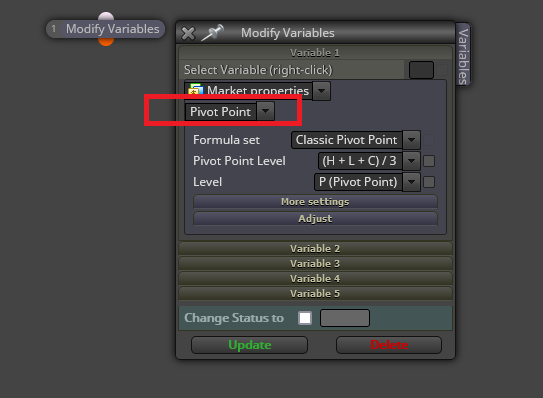
@alphaomega Are you sure the indicator doesn't repaint? I guess it does. You can get all pivot points required for any potential trade by selecting this:
(English) I will try to help everyone in these fxDreema forums. But if you want to learn how to use the platform in depth or more quickly, I can help you with my introductory fxDreema course in English at https://www.theandorraninvestor.eu.
(Català) Miraré d’ajudar tothom en aquests fòrums d’fxDreema. Tanmateix, si vols aprendre a fer servir la plataforma amb més profunditat o més de pressa, t’hi puc ajudar amb el meu curs d’introducció a fxDeema en català a https://www.theandorraninvestor.eu/ca.
(Español) Intentaré ayudar a todo el mundo en estos foros de fxDreema. Sin embargo, si quieres aprender a usar la plataforma en profundidad o más deprisa, te puedo ayudar con mi curso de introducción a fxDreema en español en https://www.theandorraninvestor.eu/es.
-
@l-andorrà Thanks for the tip with the poivot points... Not sure about the repaiting part... could easily be because I have been playing with these settings for over a week and could not get it to compare. Naturally I must be to thick to understand it. Thanks for your reply, you are always a savior!
-
@alphaomega You're welcome.
-
@alphaomega said in Trendline settings:
Could someone please help me understand how these settings in my trend line condition should be setup to match the picture?
My shared link https://fxdreema.com/shared/IuykC4Tmc
What I need is settings according to this picture:
And here is the Indicator:
0_1647364536420_Autotrendlines 3.mq5Thank you
Are there any coders in the house to help me here Please. I need the buffers set to the Trend line not the Sup and Res horizontal lines. It is not that much code. I am just to thick to know how to do it...
Pretty Please -
Hi @AlphaOmega . How are you?
About your auto trendline, have you check the trendline in the Object List? -
@biztet I am good... looks like you also doing well..How is your trading doing?
. I do not want to use object on chart it become tricky.. I have it setup in my metatrader but have to use like 5 timeframes to get the desired levels.. Will be better if I can have the code chaged or have an Icustom code to direct the expert to the indicator..
Look how much space this is taking as loaded in present.. like my whole computer

-
And here I am struggling to get the pivot points on different time frames..
https://fxdreema.com/shared/x8NFtfjR -
@AlphaOmega I'm a man of logic. And so it's easier for me to use only standard indicators. Roar makes me realize that all custom indicators starts from the standard indicators. Since then i only use standard indicators, mostly MA, RSI, STOCH. Maybe custom indicators just create a short cut from several conditions to get a single trade signal. So complicated. Hope you can get it done.
-
@biztet But this is standard indicators.. trend lines following the low and high of candles
-
Hahahaha.. I just make my strategy as simple as possible. Stoch, RSI, overbought, oversold.
And to get a good setting, this is where you make use of the Strategy Tester. -
@alphaomega This isn't just using the high and low, as usual it has more logic involved than that, the blue line is 0n the to highest points, but how does it know when to hold the previous point, maybe it'd the candle number, maybe not, the red line isn't just using the lows otherwise it would be on candle 0.
Learn fxDreema Without the Wait!
My comprehensive book, available on Amazon, is packed with examples and invaluable insights to help you fast-track your learning journey.
The paperback and hardback editions include MT4 & MT5 QR codes for easy access to all prebuilt projects and robots, including my latest gold trading robot!
Don’t miss out
Click here➡️ https://mybook.to/fxDreema to get your copy today!
Enjoy! 😊
-
@jstap Thx for taking a look... yes I know it complicated because I tried every setting to get the normal trndline setting to work as the indicator but to no avail... I think its a great indicator manually. I use it every day. I even tried to contact the owner of the indicator... got no reply.
The coder wrote this in the code.. maybe it can help:
//| Automatic trend lines. |
//| Type 1. With two extremums. |
//| 1) From the current bar "go" to the left and look for the first |
//| (right) extremum point with the InpRightExmSide bars on both |
//| sides. |
//| 2) From the first point again "go" to the left and look for the |
//| second (left) extremum point with the InpLeftExmSide bars on |
//| both sides. |
//| 3) Draw a trend lines. |
//| |
//| Type 2. With extremum and delta. |
//| 1) From the current bar "go" to the left and look for the second |
//| (left) extremum point with the InpLeftExmSide bars on both sides.|
//| 2) Starting with the InpFromCurrent bar from the current bar and |
//| to the second extremum point find the bar with minimal delta. |
//| 3) Draw a trend lines. |
//| |
//| NOTE: |
//| 1) The lines are recalculated only when a new bar appears |
//| 2) The current unformed bar does not included in the calculations|
//| 3) The extremum means a bar, for which the left and right |
//| N bars have minimums above and maximums |
//| below.