Tested R&S levels
-
Please , how can I build and EA for tested resistance and support level?
-
@blunt More info would be appreciated. What exact conditions would rerequired?
-
once the last bar low crosses above the S level and closes above the bar open price the EA will open buy
once the last bar high crosses below the R level defined and the bar closes below its open the EA will sell
the EA will also draw lines corresponding to defined S/R levels so you can easily modify them directly on charts -
@blunt said in Tested R&S levels:
once the last bar low crosses above the S level and closes above the bar open price the EA will open buy
once the last bar high crosses below the R level defined and the bar closes below its open the EA will sell
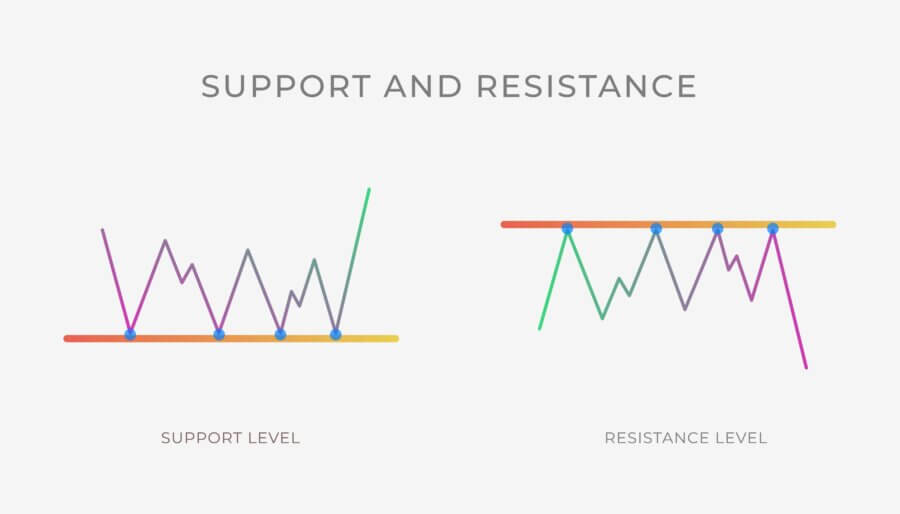
the EA will also draw lines corresponding to defined S/R levels so you can easily modify them directly on chartspost a screenshot of a chart with what you refer to as support and resistance next please.
-
-
@blunt said in Tested R&S levels:
let me get this logic straight now then...
Every time that price has created a high or low at a price level, 4 times, this is support and resistance? -
@tipsywisdom I have also tried this support and resistance strategy but could not get it in a zone of the price bottom (support)) and top (Resistance). The zone should be +/- 25 pips wide, with Ma200 in that zone. Also, I do not want to read on-chart objects, like the miro1360 tutorial. I am just to dumb to make it work with variables and calling of the Sup and Dem indicator.
https://fxdreema.com/shared/vTjtfQ5ic -
Can you please add the link to the indicator used? I would like to test your EA.
-
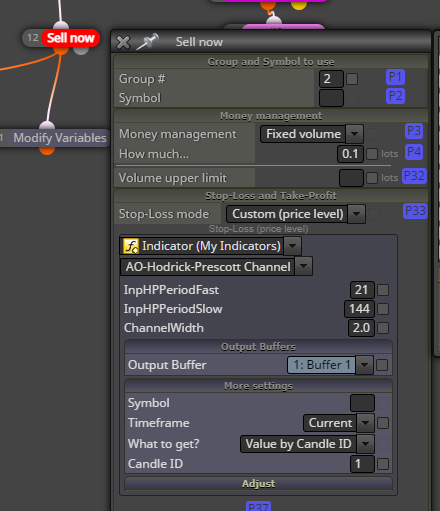
I meant the one stored in block 12, even if it is not used it is necessary for compiling, or I would have to change block 12, which I don't want to do for the time being.RGoo
-
-
Thanks very much.
-
@AlphaOmega Thanks for sharing but when loading it in fxdreema this mq5 code does not work