Another trend line project
-
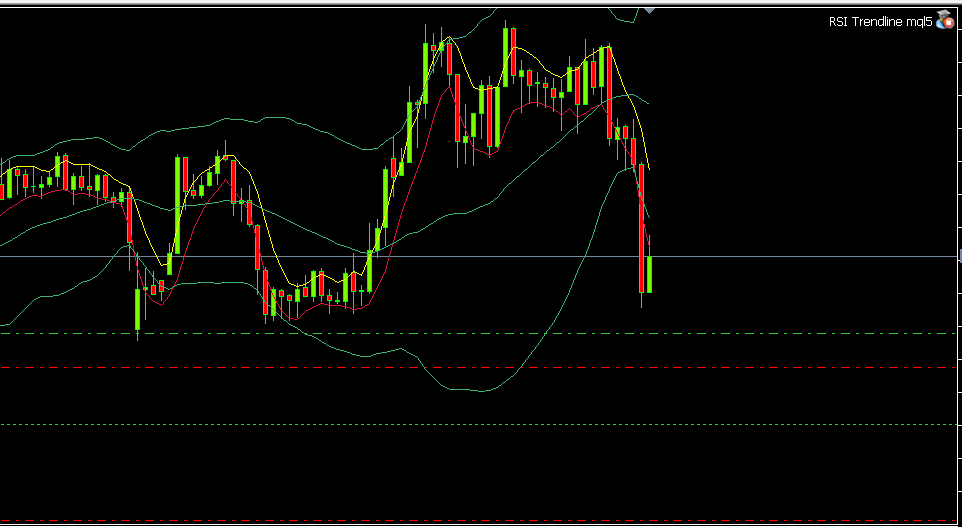
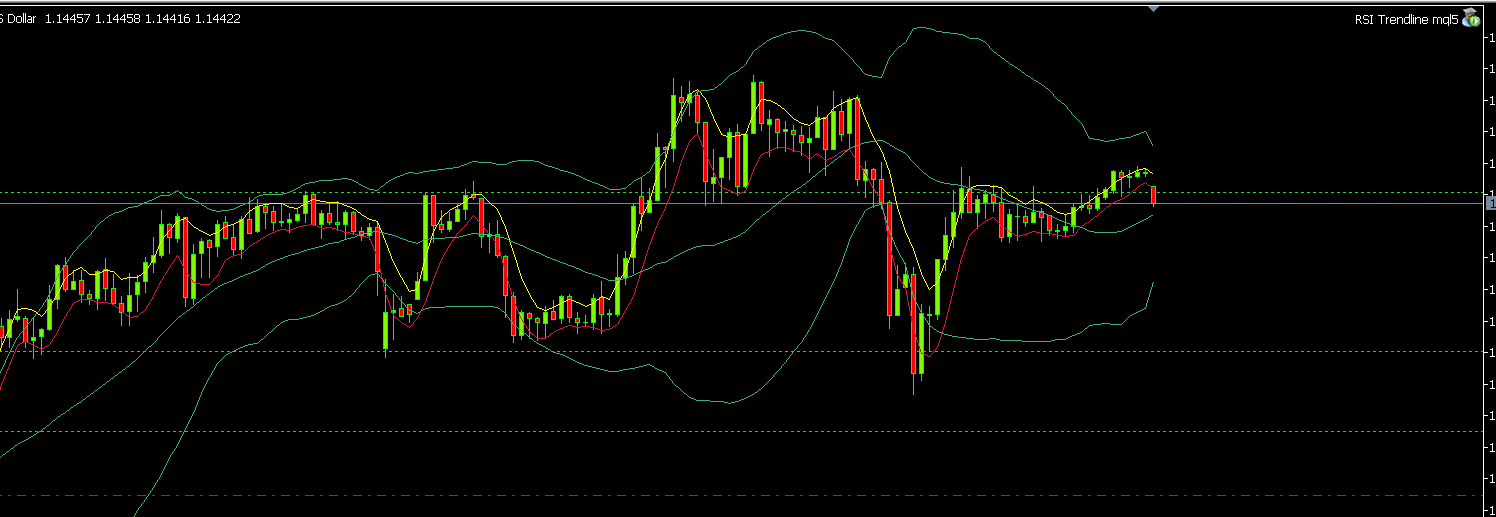
First time i'm posting in this section, just wanted to share with you my project drawing trend lines.
It draws dynamic support resistance lines, on higher lows and higher highs, using RSI, and linear regression formula, to find best placement of the line.
This is one version of the project which as all can be indefinitely upgraded.. if you want to add something.
https://fxdreema.com/shared/jbgI13yne -
@seb-0 Very nice and informative project... Thank you for sharing brother!!!
-
@alphaomega
Hey no problem! I will probably update it later : ) -
@seb-0 .. For some reason I cannot see the line... My background is black... what color is the line?
-
@alphaomega
Try this on "once per bar"
https://fxdreema.com/shared/jbgI13yne -
@seb-0 I think I am doing something wrong.... still cannot see the trenldine...
-
@alphaomega
I see that you have a red square beside the EA name, are you sure you have it enabled ?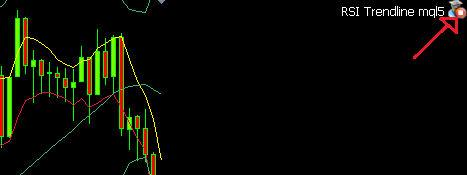
-
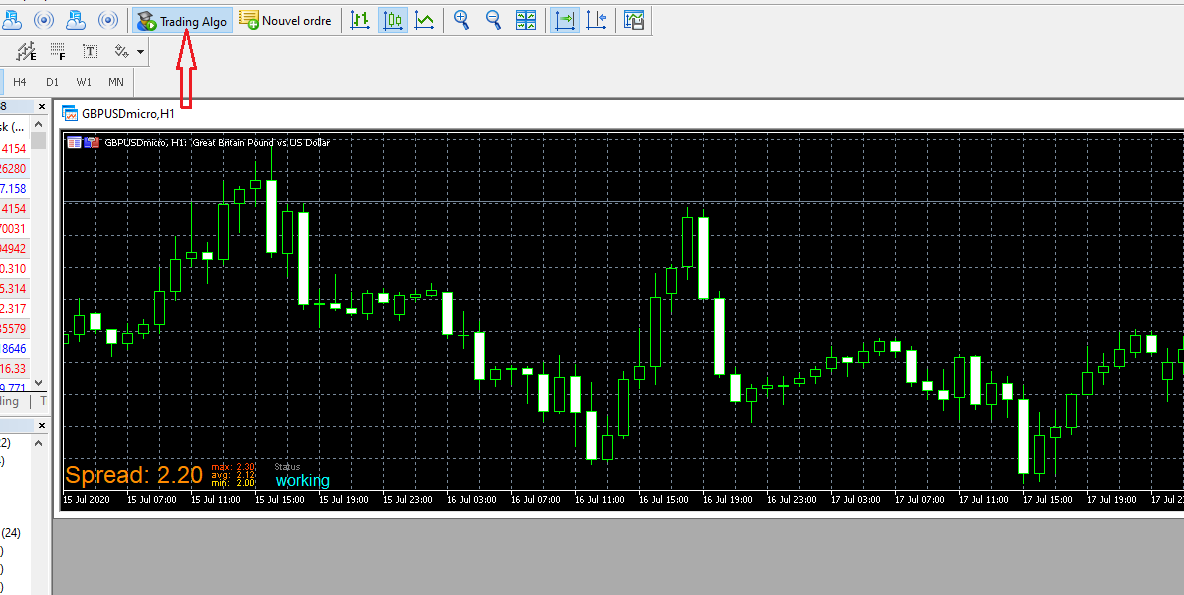
@seb-0 ... You are correct... I didn,t have that Algo thingy on... but even with it on I am still not seeing any trendline
-
@alphaomega
If you are testing it on live, the lines can take some time to appear as the opportunities are not frequent. You can backtest it to see quicker result, or make the parameters less strict. -
@seb-0 .. Thank you seb for the help.. I will check it out and let it ride a bit.. greatly appreciate your inputs
-
thank you so much for sharing, I have been looking for how to do this.
I have some questions for you.- you said the ea considers higher highs and lower lows only, what values would need to be changed to consider lower lows and and higher lows? can you share this example?
- I want to automate this so that it trades once candles or indicator cross EA, I am new to fxdreema. so please bare with me, I am still learning. would you mind showing how to buy or sell automaticaly when indicator crosses trendline?