Draw line for average bid and ask
-
Hi I would like to have my EA draw a line equal to the bid and another equal to the ask. I need it to plot the historic bid and ask as well (it can keep running and draw it real time if this is not available data on mt4). The line can be similar to a MA or even MACD in an indicator window, I just cant find a block to draw something like this
-
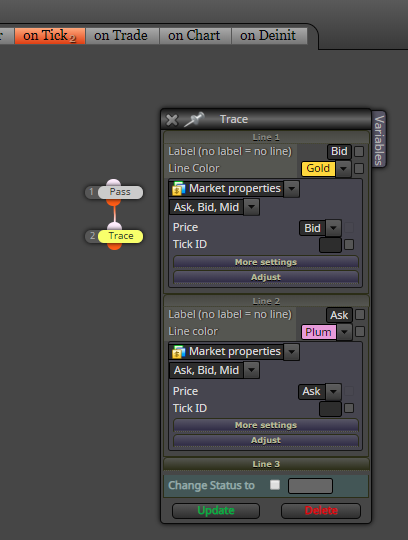
use Trace block
-
Awesome thanks. I double checked, I use the offline version of the program and it does not have this block (I travel a lot and don't always have access to the internet). I tried updating several times but the download option downloads build 100, which is the same one I have installed so not sure how to update the offline version?
-
Apologies for all the questions. I created it in the online version for now and noticed a few blocks that might make it better. If I use the write to file block can I store the data (bid and ask price) somewhere and have the indicator somehow pull from it to draw a new line?
And then last question, is there anyway to draw the line in an indicator window rather than the chart.
Thanks again for the help
-
In the offline version the block is named "Indicator tester" or something like that. The idea of this block is to print values on the chart, so you can see them... mostly to test the output values of custom indicators. It does that by printing multiple trendlines, one for each candle. It is not intended to be used as a custom indicator itself
")
-
Thank you found it, works perfectly. Anyway to have the EA draw these line in an indicator window?
-
I think I can try that for Trace. It always prints the lines in the main windows, but sometimes I'm printing values from some indicator and they can't be seen in the main window. Which is not that big problem when I just want to see whether the values are different than 0 or EMPTY_VALUE and then I remove the block