Draw Trendline and Swing for support and resistance
-
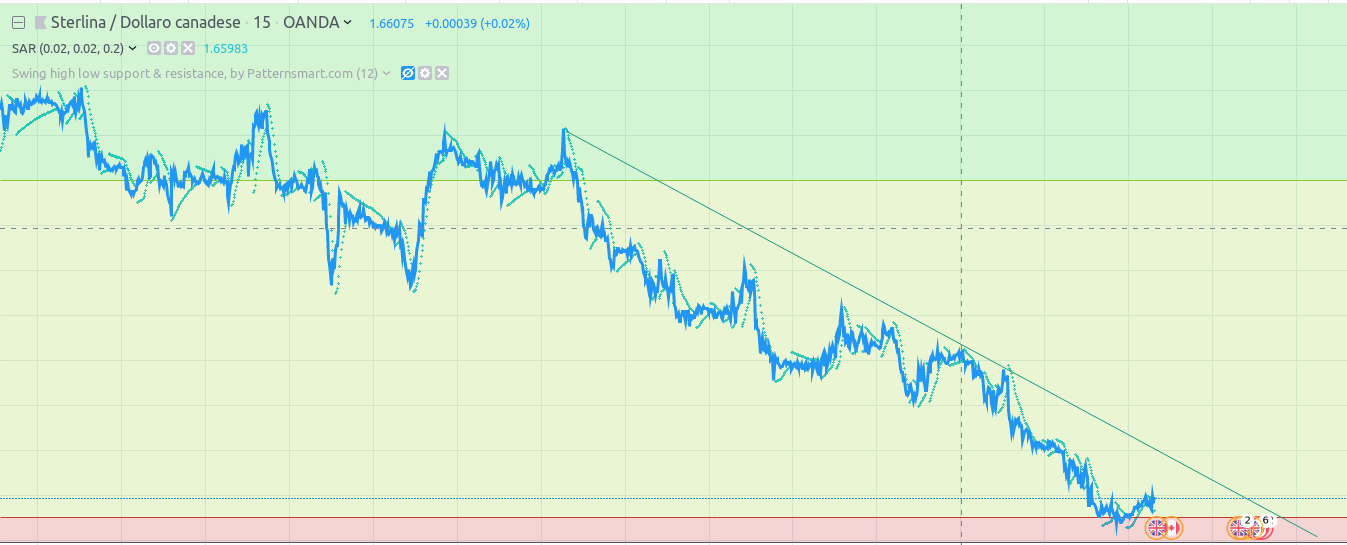
I liker to draw a trendline like this in attachment.
Can someone explain how can i to do ?I try with market place but i don't know it so much.
-
This is my weakest point on fxDreema. I am also interested on how to do that.
(English) I will try to help everyone in these fxDreema forums. But if you want to learn how to use the platform in depth or more quickly, I can help you with my introductory fxDreema course in English at https://www.theandorraninvestor.eu.
(Català) Miraré d’ajudar tothom en aquests fòrums d’fxDreema. Tanmateix, si vols aprendre a fer servir la plataforma amb més profunditat o més de pressa, t’hi puc ajudar amb el meu curs d’introducció a fxDeema en català a https://www.theandorraninvestor.eu/ca.
(Español) Intentaré ayudar a todo el mundo en estos foros de fxDreema. Sin embargo, si quieres aprender a usar la plataforma en profundidad o más deprisa, te puedo ayudar con mi curso de introducción a fxDreema en español en https://www.theandorraninvestor.eu/es.
-
If you know, isn't there anyone who can help us with this?
-
Yes, the administrator for sure, but he is not here ver often :). Then other brilliant users like miro and roar.
Are you there, folks?
-
drawing such trendlines is possible with the help of regression channel, you must find the regression channel indicator (for MT4) which print the values into buffers (forget the ones that draw standard regression lines) ... if you dig the google very deeply, you will be able to find something (long time ago I found something, ... I don't know the exact name of indicator and I don't have that strategy saved, but I am 100% sure that I found and it worked in fxdreema) ...
-
@l-andorrà said in Draw Trendline and Swing for support and resistance:
This is my weakest point on fxDreema. I am also interested on how to do that.
Exactly. When I'm trading (manually), I always draw trendlines, they are one of the most used indicators for trading. Once I actually started writing code exactly for that - to find where the trendlines should be. But they are not something that is straight forward, everyone can draw his trendlines differently. Or, if a program draws them but some rules, someone can disagree with these rules. So I think the answer is to find some indicator that prints these. It will probably have bunch of input parameters
-
@fxdreema @l-andorrà @miro1360
I try to look for the indicator recommended by Mirco, otherwise I will look for an indicator as proposed by the administrator.I still have the problem of understanding how to manage time.
If for example the price crosses the trendline and I want to open a buying position only after a retracement on the same trendline, how can I know which is the id of the candle that it retraces?
example:
candle id 5(id 5 is a example) x> trendlineup
next candle (id ?) touch trendline and use it as support ...(how can i know candle id of this?)i have the same problem with all my strategy and i don't understand how bypass or manage this problem.
-
There is an effective but innefficient way to do it. Create a variable called bar_counter. It will count how many bars have been created since moment 0 ('Once per bar' --> Variable +1).
Then create tow additional variables called line-crossing1 and line-crossing2. Every time a bar crosses line they take the value of bar_counter. That way you will have two different bar ID values.
-
@l-andorrà said in Draw Trendline and Swing for support and resistance:
That way you will have two different bar ID values.
eh...but...if the condition is the same for line-crossing1 and line-crossing2, how can i to do for to lock the value of line-crossing1 and give a value only to crossing2 ? If the condition is the same, the EA change the value of both variables in the same moment.
In general , i don't understand how say to any my EA, if a condition true occurs (A x> B) and then "after" another cross occurs without knowing when there is a new cross (A x> B). "After" how is encoded inside the blocks?
Please, can you give me a simple example for understand this concept ?
I don't understand how to manage time in case I can't know the future candle ID, it seems to me that I can do it only if I am using conditions of> and <and therefore not x> or <x -
Could you please share your project? It will be much easier for you and me to talk about concrete blocks than theoretical conditions.
-
(this is an old topic but ... posting just in case if it helps )
Not exactly how you need but still see if you can try similar to this Sample EA
https://fxdreema.com/shared/DglI7iUJd
Use this example Only with Demo account and to understand how it is working.
-
@rp13579 Once more, thank you for sharing.