Hi,
currently testing different approaches but need for closing position.
Thank you in advance 
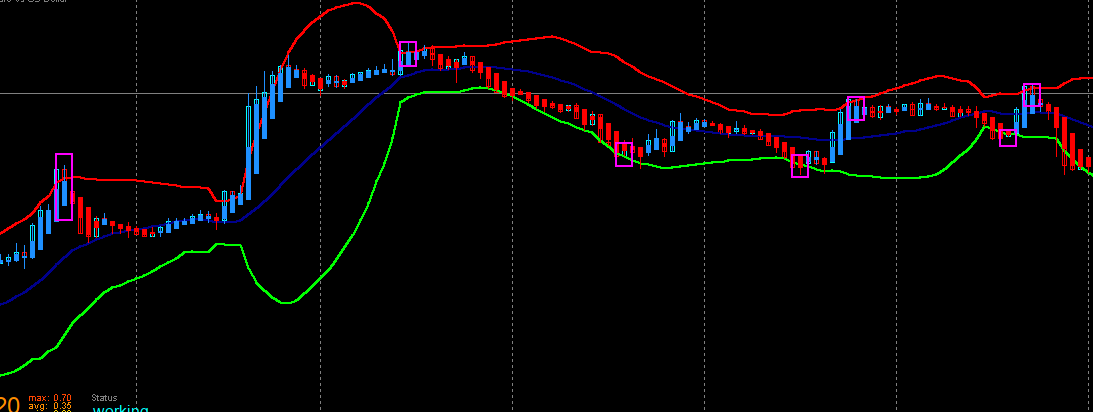
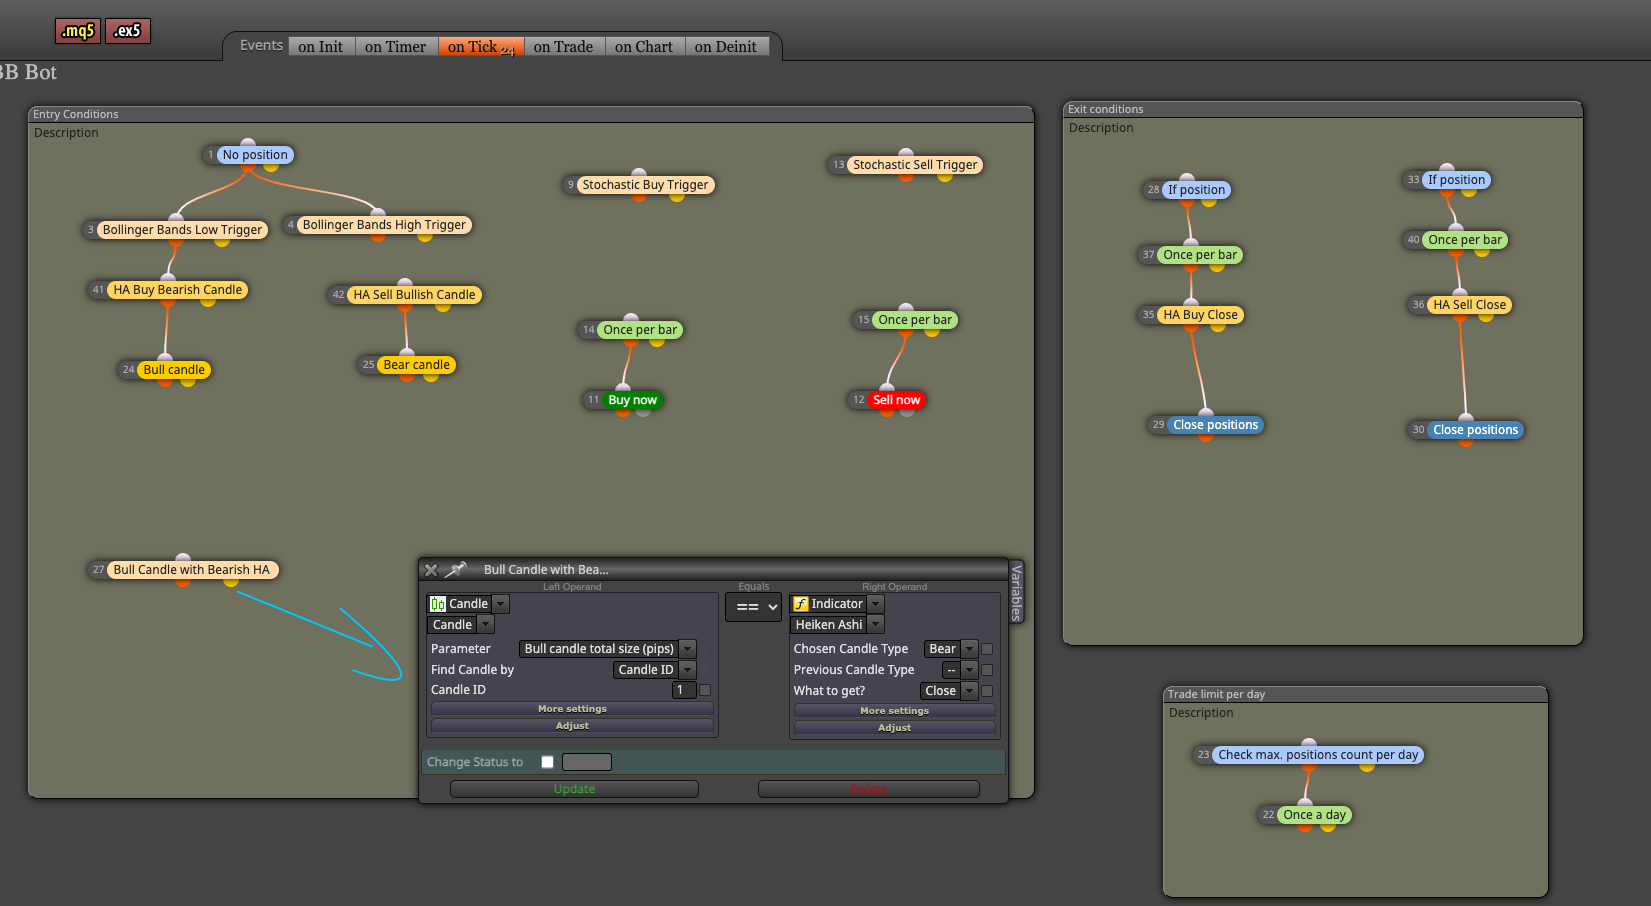
Using Heiken Ashi Candles and Bollinger Bands as main system components.
Main idea is to trade from upper deviation to lower and from lower to upper.
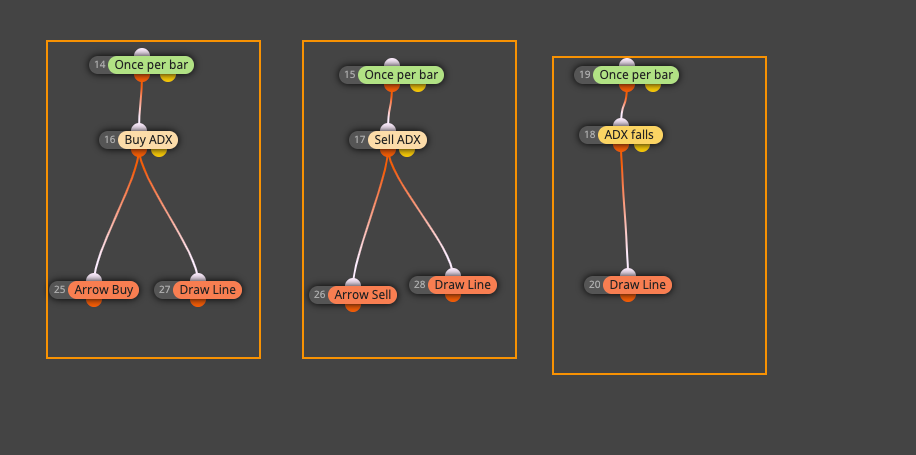
Would like to keep things very simple by 2 handles for condition block for "if trades" for open trades.
" And" "or"
This would be possible example:
https://fxdreema.com/shared/lnmISqkAb
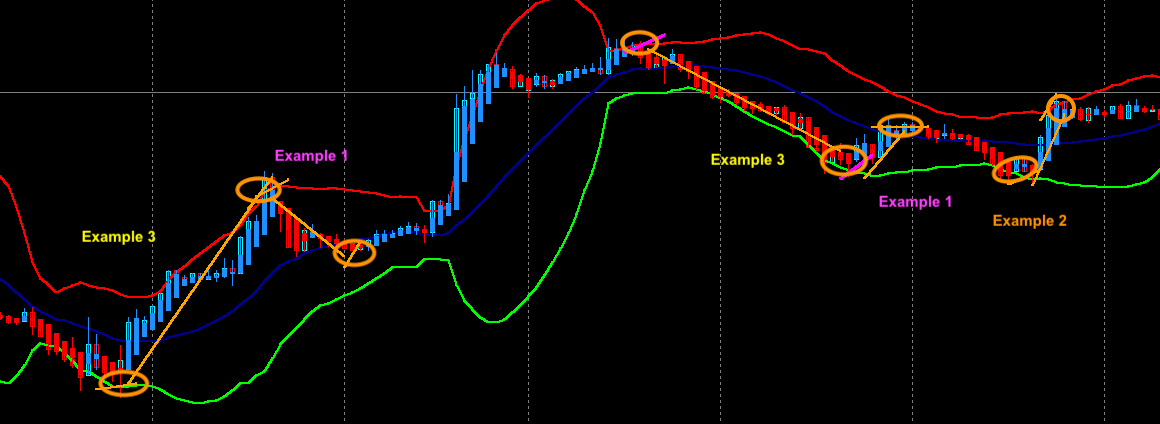
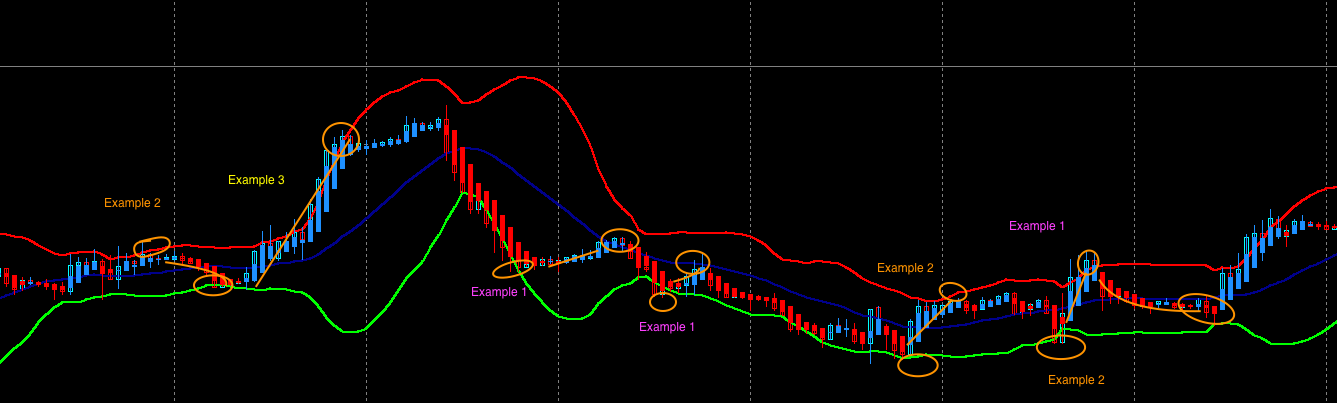
What if found from testing when trade is open there are mainly 3 different outcomes possible:
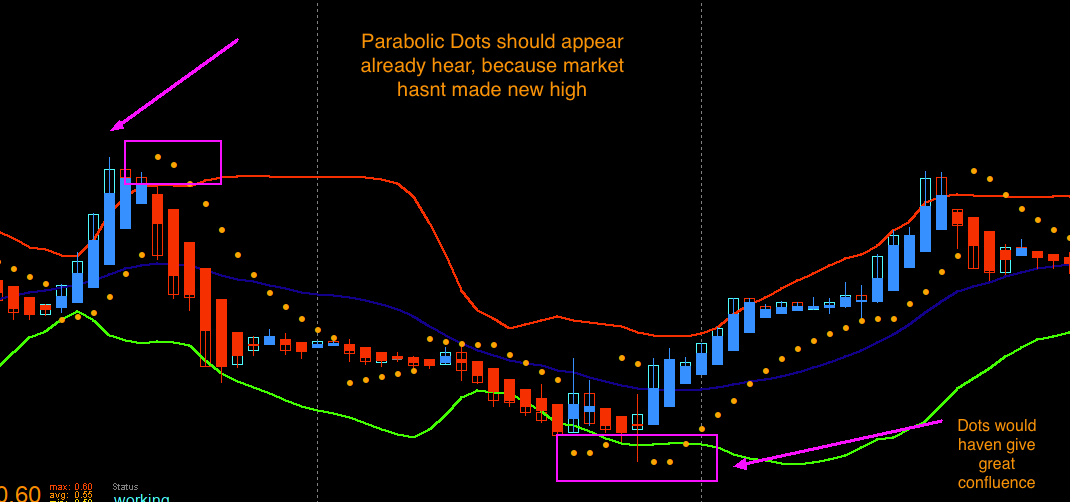
price consolidates at middle band and it would be best to close position
price arrives at other Bollinger Bands, loss of momentum and then reverses so it would be best to close
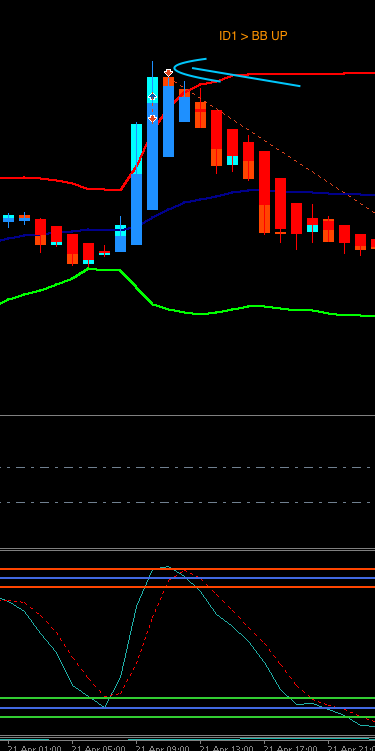
price arrives at other Bollinger Bands but momentum continues shown by HA candles and then if Heiken Ashi switches color near band it would be best to close.
Simply, if momentum continues it should run,
if momentum stops or market starts consolidating it should stop.
Has somebody good results from ADX and DI crossing?
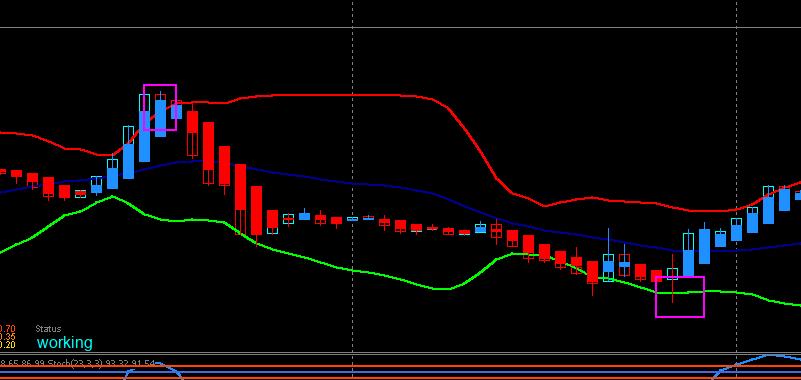
What i've found to just close it by opposite Heiken Ashi color would often cut trade way to early, in the "neutral Zone" between Bands and where Moving Average is.
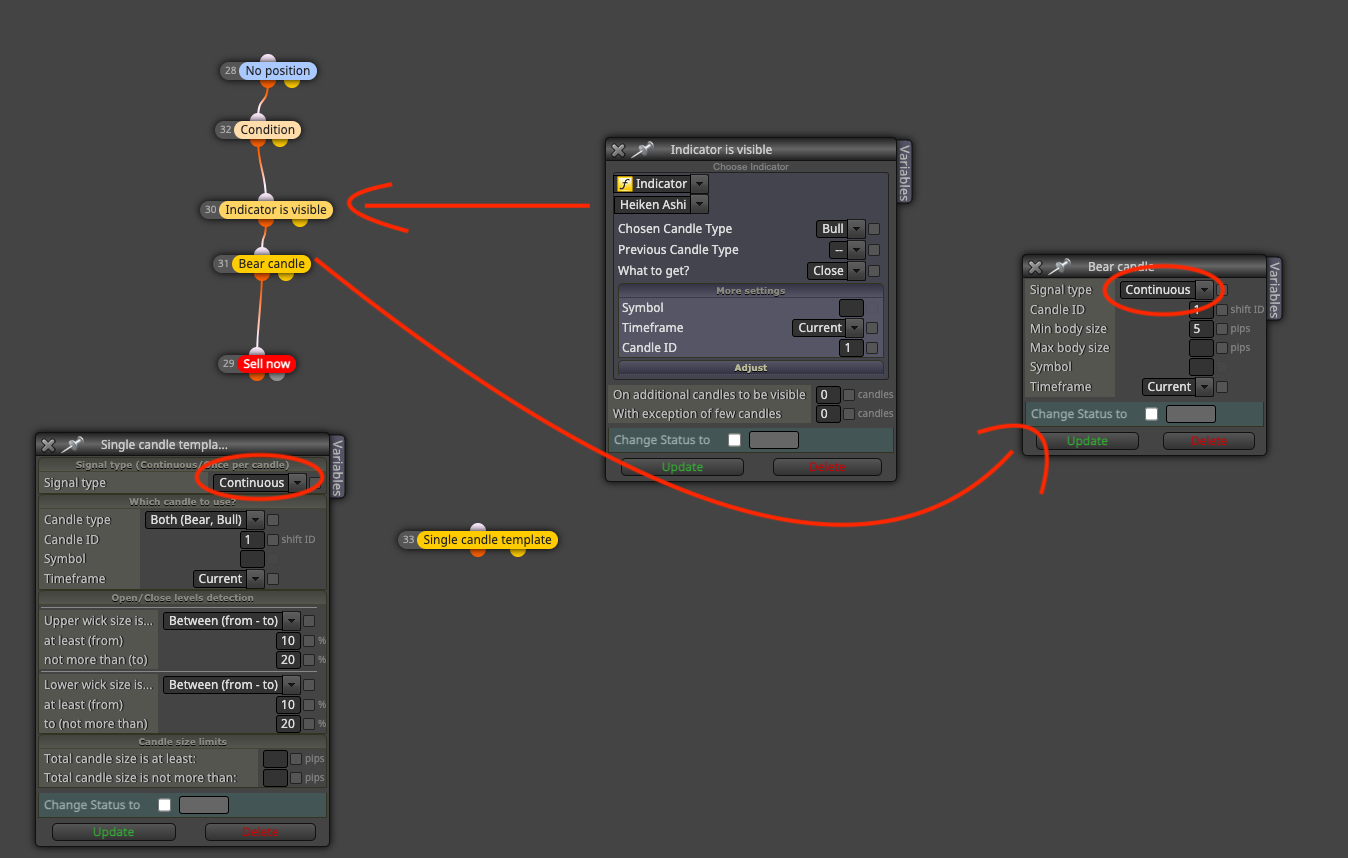
Because there is only option in fxdreema to using Heiken Ashi but color and candle wick/type but not as heiken ashi dojis- loss of momentum/consolidation,
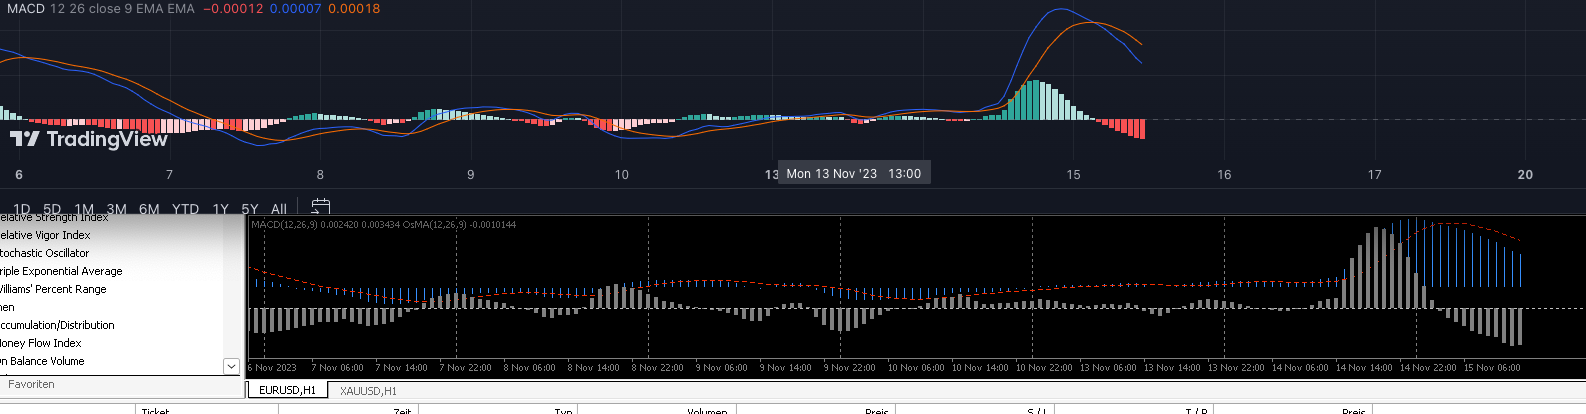
found that is would be best to have conjungtion with momentum as well to keep it simple.
I've testet common momentum indicator like RSI, Stochastic as well but found that that in ranging condition works good as extra confluence but if momentum keeps on going it market would continue way long at bands if heiken ashi color hasnt changed even if stochastic is oversold/overbought and or main line has crossed back below 80/20 Level.
Also testet approach to fixed Risk reward but due that every trade situation and outcome is different, found that simple 2:1/ 3:1 doesnt work, because sometimes market stops at middle band and sometimes want to continue even further.
Also found that every form of trailing stop would cut profit to early as well, because market is allowed to have wiggle room when expending and is even allowed for shorter retracements, because it is how markets tends to move.


 as values as inputs?