Hi there
After a long time testing and refining strategies, I have deved a strategy using FXDreema that performs well, but only on EURJPY and USDJPY.
The strategy is a simple moving average set of conditions. The stops and profit targets are ATR based. I know if I could use more a moving average based profit target it could be even more consistently profitable so I'm working on this. The biggest improvement to happen to my EA is by using Strategy Quant EA Analyzer. In this program it can show me all sorts of amazing insights into when and how the robot is performing well. For example, trading only between certain hours each day, certain days of the week, months of the year and maybe long or short only, so I've added these conditions as input variables. It is very much possible to filter out consistently losing hours of the day, for example session time starting or ending when markets turn, and makes a HUGE difference in performance. Just look at the profitability by each hour of the day:
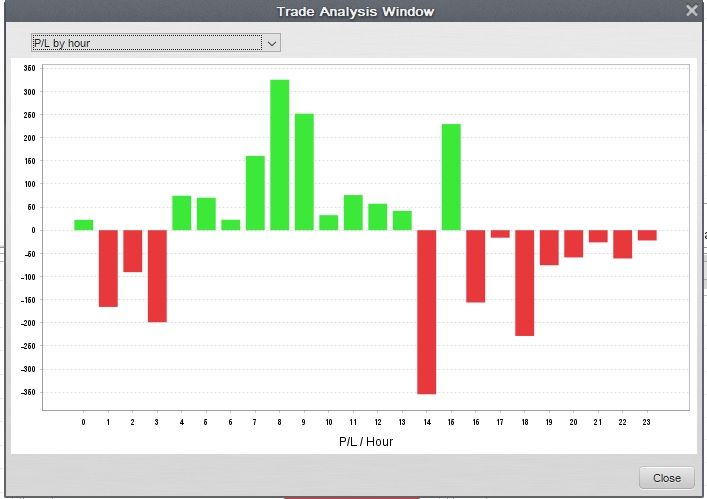
Now, based on that graph, you would know exactly what hours to only trade in, right?
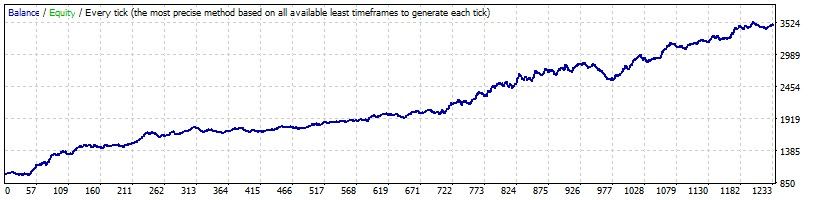
I know I can get it to be even more consistent with more work. Below is my 99% accurate backtest result for the past 4 years on EURJPY, over 1,200 trades, trading 0.10 lots on each trade (Linear growth). I know it's not jaw dropping returns at the moment but it's a step in the right direction. I'm more concerned with consistency.
Interesting stats:
Bars in test 451635 Ticks modelled 416983727 Modelling quality 99%
Mismatched charts errors 0
Initial deposit 1000.00 Spread 15
Total net profit 2487.58 Gross profit 9771.72 Gross loss -7284.14
Profit factor 1.34 Expected payoff 2.02
Absolute drawdown 22.37 Maximal drawdown 321.04 (11.16%) Relative drawdown 11.16% (321.04)
Total trades 1231 Short positions (won %) 561 (47.42%) Long positions (won %) 670 (46.12%)
Profit trades (% of total) 575 (46.71%) Loss trades (% of total) 656 (53.29%)
Largest profit trade 73.56 loss trade -40.11
Average profit trade 16.99 loss trade -11.10
Maximum consecutive wins (profit in money) 8 (98.45) consecutive losses (loss in money) 11 (-161.98)
Maximal consecutive profit (count of wins) 182.11 (6) consecutive loss (count of losses) -161.98 (11)
Average consecutive wins 2 consecutive losses 2
SQ gives it a 'stability' rating of 92%, meaning it's fairly consistent.
I am currently forward testing on demo with promising looking results. I would also be keen to see if I can filter out even more losing trades by stopping trading during high impact news event times. But I need to research their effects first. Happy to update this thread as and when more detail comes in.
")