Thanks!
Is there any possiblity to read it out on Init and let the EA react dynamic on the broker/symbol pip size rules?
Thanks!
Is there any possiblity to read it out on Init and let the EA react dynamic on the broker/symbol pip size rules?
Hi guys,
I run into some issues with my EAs in regards to the position size calculation from the function "Risk % of Balance":
I use the same EA (https://fxdreema.com/shared/m6exuaaCb) on different Symbols and different broker. I backtested the strategy with tick data from Ducaskopy - size calculation worked well. But on my account with Darwinex the EA goes wild on GBPCAD and returns a the position size 100 times too high. All other symbols work as expected.
Additionally, I startet a challenge at FundedNext with other EAS, but the same buy/sell blocks and the size calculation is on all symbols roughly 100 times too high.
Has anyone an idea how to troubleshoot it or had even experied the same issue in the past?
Thanks in advance for your time and support!
Ticksize for JP225 is 0.01 and US30 also 0.01
That's the problem? I don't get why. Could you please elaborate?
@Mani13 I run into the same issue. Could you please share your way forward?
@fxDreema Boss, could you step in?
Does anyone know how to fix this?
Hi folks,
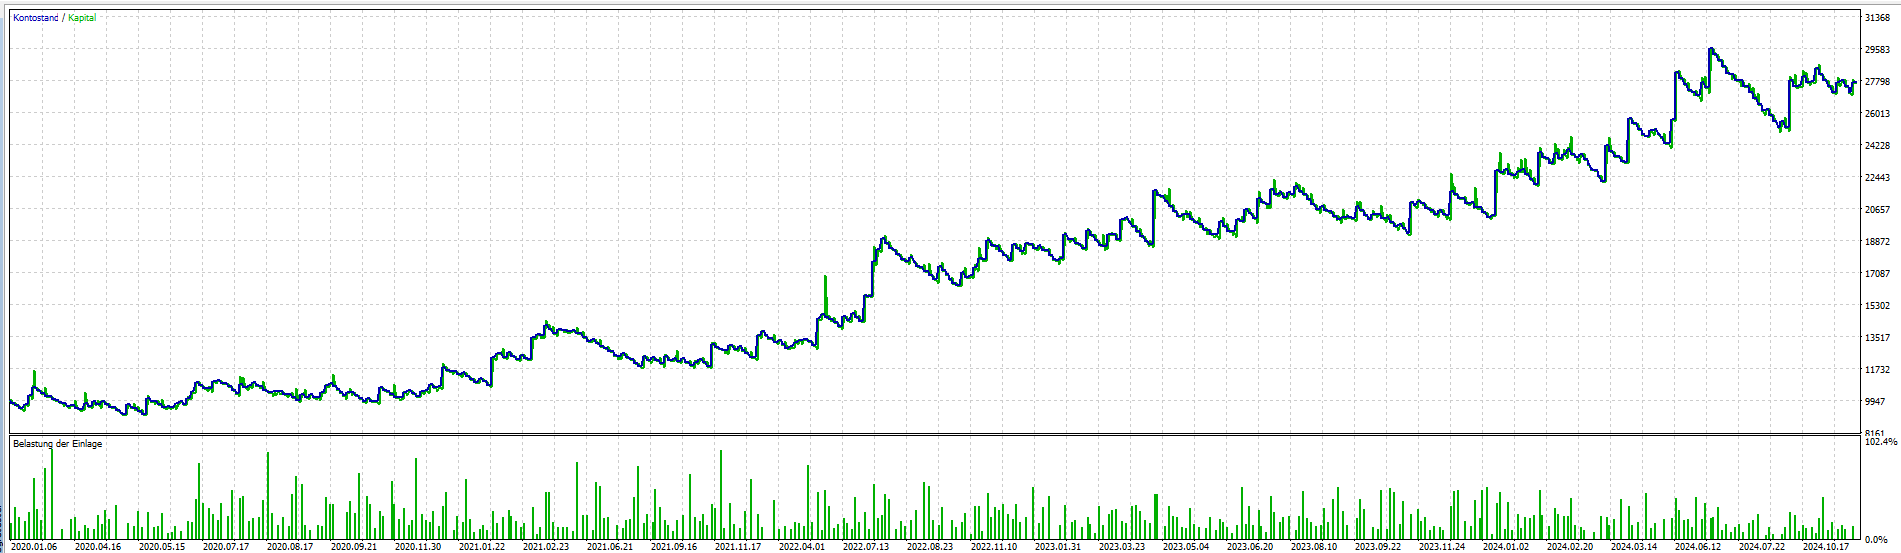
I created a little EA to trade indices: https://fxdreema.com/shared/iGFAaIevd
It works as expected on all US indices, but on JP225 the position size calculation is weird. The constant entered in block 89 "Risk_in_Perc" gets misinterpreted. It's possible to run the EA with values above 100%.
Here's the equity curve with 200%:
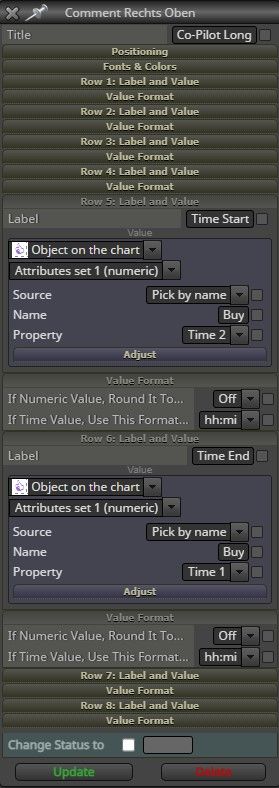
@l-andorrà But on the first screenshot (Comment Rechts Oben) is the object selected. Sorry, I'm not getting what should be changed  Could you pleaser mark it on the screenshot?
@l-andorrà Thanks for sharing the example. Imho my settings (see first screenshot) are like this. Do you see any difference?
I am wondering why the desired formatting (hh:mi) is not applied.
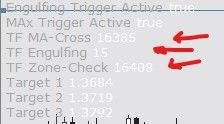
FYI I draw a rectangle into the chart to determine an "area of interest" where the EA ia allowed to enter positions.
Hey guys,
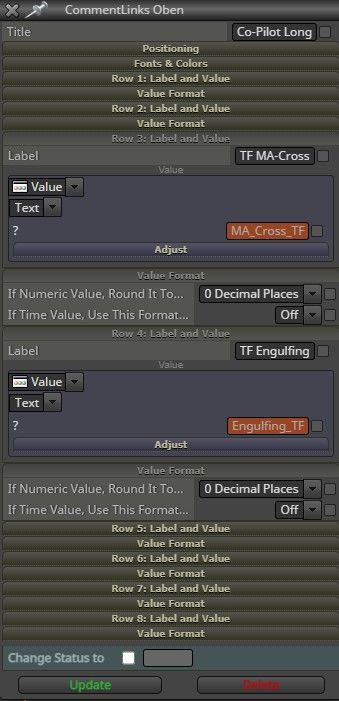
I could solve the second part of my question. The selected candle periods are displayed correctly as soon as I use "Value - Text(code input)". All time format display missleading values. "Period_M15" is displayed as "15:00" in format HH:MM.
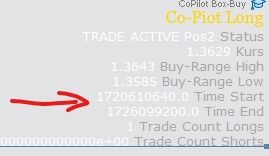
But I couldn't find a setting to display me the starting and end time of a rectangle I drawed into the chart. In other words: I would like to see via the comments at what time my rectangle starts and ends in a time format. Any ideas?
Hi folks,
I would like to use the Comment Block to display me a few date settings of the EA. Does anyone have a clue how to fix this?
Thanks!
And a similar thing with periods:
@jstap Many thanks for the hint!
Any idea to read out the begin and end time of an rectangle? I used before the logic to draw lines and use them later in the script to put pending orders on it, but the usage of rectangles is pretty new to me 
@biztet Hey body, do you know where I can find an instruction on how to build this?
@l-andorrà Hello, the google search directed me to this post. Do you think the tutorial you had mentioned could be recreated? IMHO it would be a killer feature to draw into the chart "valid-zones" and the EA does only there what it is intend to do ")
@ambrogio I started it from the scratch and it's working now! Thanks for checking it!
Hey guys,
I would love to get a hint what I'm doing wrong. I used custom indicators before without any issue and struggle now. I checked everything a few times but run out of ideas.
I would like to use the %B Oscillator and rebuild the systematical approach which was presented by StatOasis (https://www.youtube.com/watch?v=y2--vB5wgZ0).
Therefore I downloaded the indi from the mql5 page: https://www.mql5.com/de/code/7019
and defined it as custom indi in FxDreema:

I renamed the indi in the MT5 folder also to "Percent_B" to ensure the matching. Furthermore I deleted the ENUM_Applied_Price Line from the Indicator script. That was a failed try of troubleshooting it.
So far I kept the EA very simple: shared/qsa38byYc
But when I start the testing this error note appears:
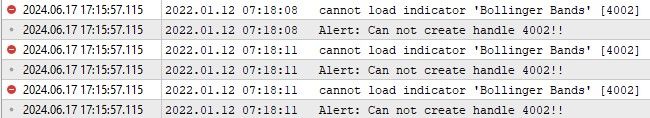
I'm looking forward to the hint that brings me back on the road!
Alright. I'll isolate the buying side and simplify it until I see where the bug is. Thanks for your time!
I'm using the "For each Object" Box (#8 and #13) to read out the Line-Price-Values drawn at #5 and #6 to visualize the range.
I learned this approach from Boxxocode (YT /watch?v=t83C-tfJyzY&t=143s). Sorry, I'm not allowed to paste complete URLs.
Hi guys,
I picked up an Range BreakOut Strategy on YT (../watch?v=Pay-JP34YSI), which looks quite promising. To determine the correct timings to get range high and low I'm using server time and added 1 hour. I'm like the YT guy located in Germany.
But the backtest gets stopped. In the log is just written:
"CS 0 13:36:19.546 Trade 2010.04.02 14:33:00 order canceled due end of test [#2453 sell stop 0.23 USDJPY at 93.659]"
I couldn't find any suitable information on Google how to solve this
I would be very grateful if anyone could check my project (https://fxdreema.com/shared/DFr7Jebzc) and give me a hint!
Best,
Pascal