fxDreema

    • Register
    • Login
    • Search
    • Back to the main page
    • Categories
    • Recent
    • Tags
    • Popular
    • Search
    1. Home
    2. PhiLykia
    3. Posts
    P
    • Profile
    • Following 1
    • Followers 13
    • Topics 4
    • Posts 74
    • Best 11
    • Controversial 0
    • Groups 0

    Posts made by PhiLykia

    • RE: Compilation errors when using indicators with Multi Time Frame.

      Thank you for your interest @l'andorrà

      When I use special Price Type, Time Frame and/or Moving Average within the indicator, we cannot use the standard ENUM_APPLIED_PRICE, ENUM_TIMEFRAMES or ENUM_MA_METHOD commands.

      When I add it as custom indicator in Fxdreema, this problem occurs with variable definitions and it does not allow to create .ex5.

      I can use it as Custom MQL, but in this case I'm stuck on the number of blocks. 😞

      It would be great if Mr. @fxDreema intervened in this situation. tsk.

      posted in Bug Reports
      P
      PhiLykia
    • Compilation errors when using indicators with Multi Time Frame.

      Hello, lately I have been encountering compilation errors when I use indicators containing Multi Time Frame.

      If any buffer is fed with MTF, this error is received:
      'c' is not a class, struct or union. '........' - some operator expected

      And this is getting really annoying.

      posted in Bug Reports
      P
      PhiLykia
    • RE: Hedgin EA with martingale

      @tblaze16 you are doing it by heart. try to understand first, why you should "Turn Off" and then "Turn On" in which case. If you do not know your strategy step by step, it is inevitable that you will lose money.

      posted in Questions & Answers
      P
      PhiLykia
    • RE: Saving variables for reference use?

      Does it matter if these 4 candles are bullish or bearish (bullish/bullish)?
      There are no wicks on the candles. shouldn't it be?

      What do you anticipate taking as a reference for the line you have drawn? You need to define that line.

      posted in Questions & Answers
      P
      PhiLykia
    • RE: Decisive indicators, supporting indicators

      Let's see if we can achieve the "perfect" Expert Advisor using the indicator we took as an example.

      In this indicator, there are 6 zones with a range of 16.66. Let's see, what happens if you open a high lot BUY on R0B5, a low lot BUY on R1B4, a low lot SELL on R4B1, and a high lot SELL on R5B0?

      Positions will only be opened at these levels, and outside this level is close position.

      image.png

      posted in Tutorials by Users
      P
      PhiLykia
    • RE: Certain number of orders

      Use the "Check Position Count" block

      posted in Questions & Answers
      P
      PhiLykia
    • RE: Macdi

      The other ups and downs in the histogram are Candle Close2 Main Line > Candle Close 1 is bearish, the opposite is bullish.

      posted in Questions & Answers
      P
      PhiLykia
    • RE: Macdi

      for color try if main line < 0 and main line>0 cases.

      posted in Questions & Answers
      P
      PhiLykia
    • RE: EA Doesnt open live trades.

      image.png

      posted in Questions & Answers
      P
      PhiLykia
    • RE: EA Doesnt open live trades.

      https://fxdreema.com/shared/AFfoeGXbd

      https://fxdreema.com/shared/TC4b6evjc

      posted in Questions & Answers
      P
      PhiLykia
    • RE: Decisive indicators, supporting indicators

      The "WSO" (Williams' %R with Overbought/Oversold) and "WRO" (Williams' %R Oscillator) indicators are based on a technical analysis tool called Williams' %R.

      Williams' %R is a momentum oscillator that measures the level of overbought or oversold conditions in a trading instrument. It was developed by Larry Williams and is also referred to as "%R" or "Williams Percent Range". The indicator calculates the relationship between the current price and the high and low prices over a specific period, typically 14 periods.

      The Williams' %R formula is as follows:
      %R = (Highest High - Close) / (Highest High - Lowest Low) * -100

      The resulting value oscillates between 0 and -100. Readings above -20 are considered overbought, indicating a potential reversal or correction to the downside. Readings below -80 are considered oversold, indicating a potential reversal or bounce to the upside.

      The "WSO" indicator typically includes additional levels to define the overbought and oversold thresholds, such as -20 for overbought and -80 for oversold. It helps traders identify potential trading signals when the price reaches extreme levels.

      https://www.abysse.co.jp/mt5-e/indicators/Wso and Wro.mq5

      posted in Tutorials by Users
      P
      PhiLykia
    • Decisive indicators, supporting indicators

      As a result of my studies, I saw that some indicators are indicative and some are supportive. How does?
      I have studied hundreds of indicators and oscillators over time. I would like to explain how I elaborate on the indicators and oscillators that I have studied, and how I use them in an EA. Maybe my goal is to give someone a clue.
      (Sorry for my English, I will have mistakes, forgive me)

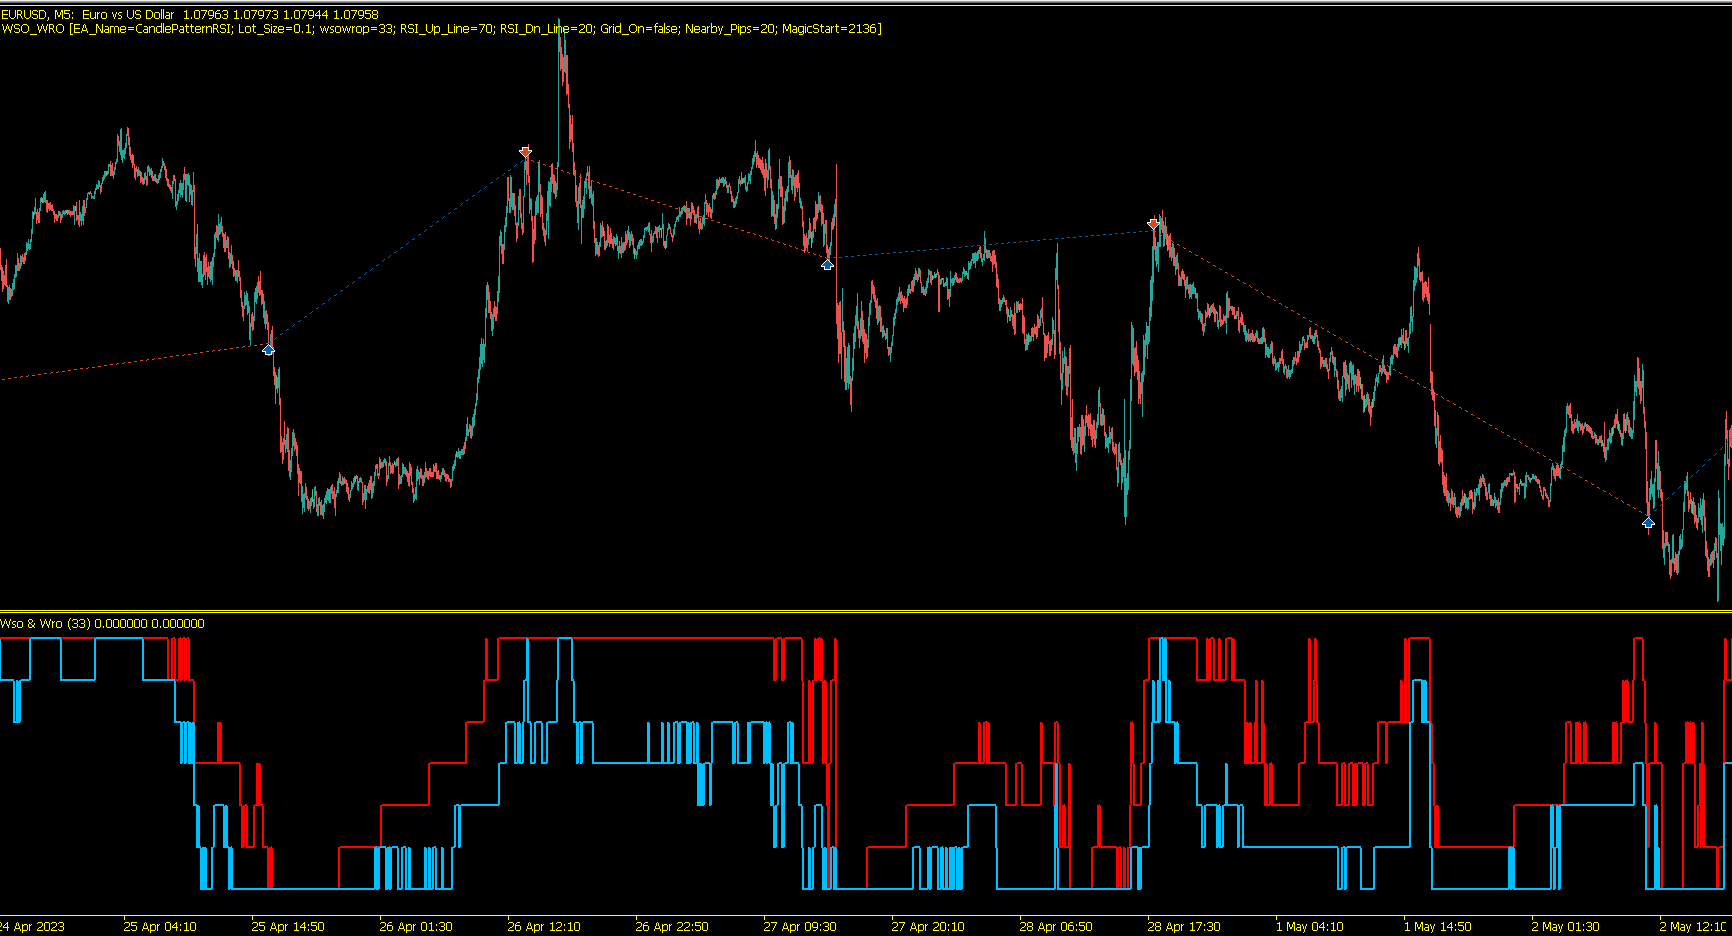
      Let's start with a random indicator, for example the WSO&WRO indicator.When we apply it to the chart, we see this:

      2b712403-8ff8-4b09-aa97-519304a1baec-image.png

      What should the indicators be doing for us? should show the entry and exit points of the position perfectly.
      Here are the points I want in this indicator:

      d1417b6c-54ff-4492-9ede-1828b8362907-image.png

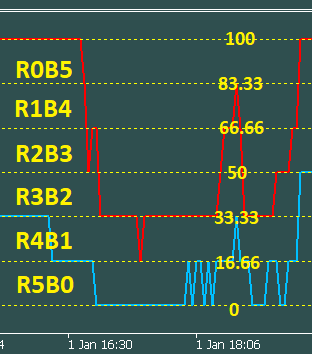
      What dots do these dots correspond to on the indicator? I see that when both buffers meet at the same point (0 and 100) it should generate a signal to me.

      If the two buffer outputs are at the same level, close in case of open position opposite.
      https://fxdreema.com/shared/cUCaIgHic

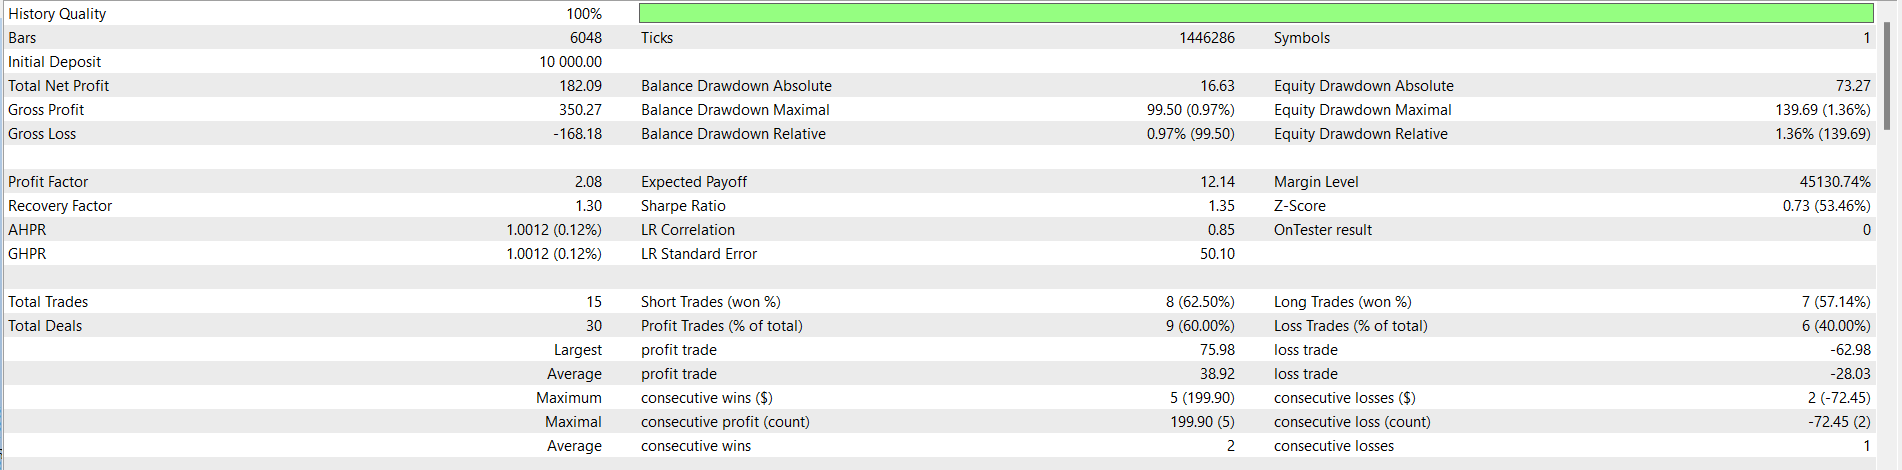
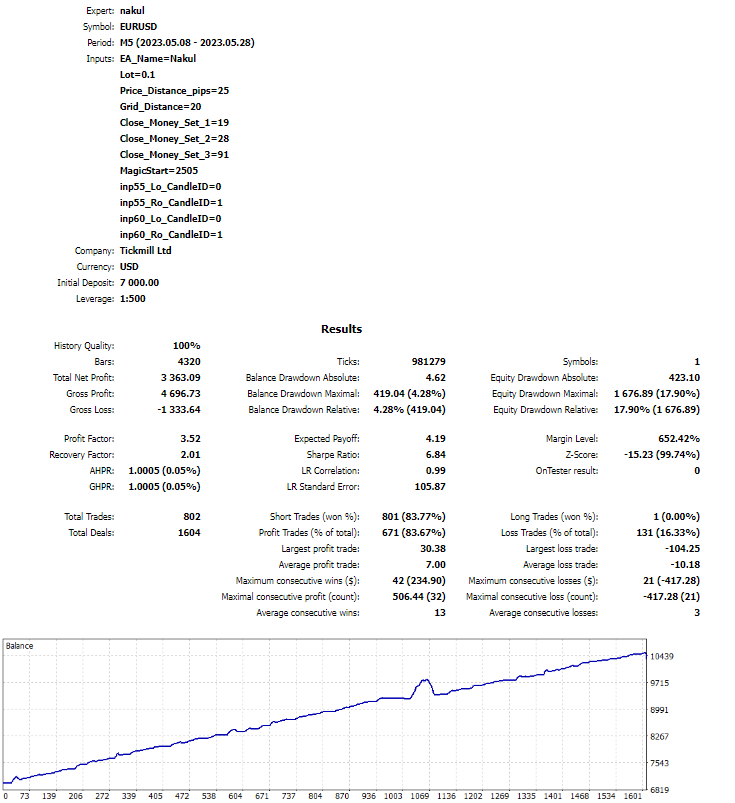
      this is the result of this EA:
      14db5942-4073-44c6-8f02-0089c3b80210-image.png

      Here is the trading report:
      f1d8ae27-bd97-4bf4-996d-44aba7a5aa98-image.png

      when we remove the "no trade/position" block from this EA:

      bda72ebc-3bb3-4d2a-a95f-13e3e031c744-image.png
      7f3b4e52-7809-4c16-9e79-d5b5243eae2c-image.png

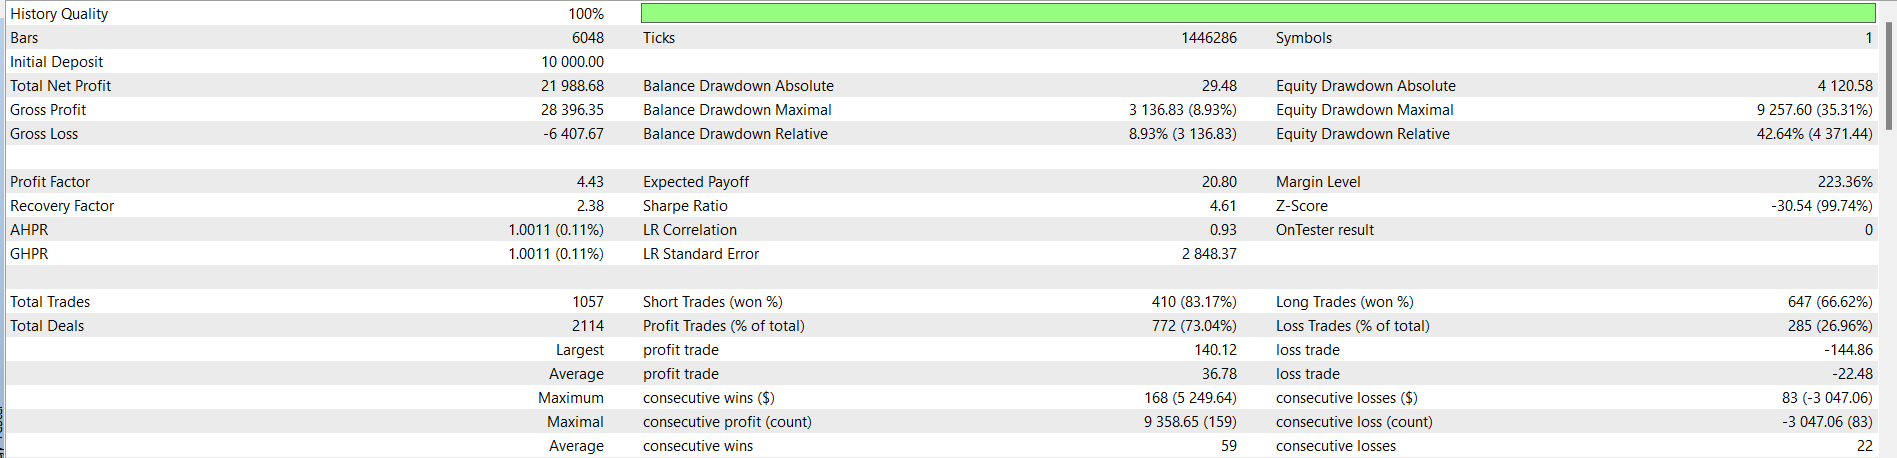
      If we apply a grid system, the EA is like this:
      https://fxdreema.com/shared/Bn9S4PwEd

      As a result, the WSO&WRO indicator is a "decisive" indicator. but it cannot produce a perfect trade report by itself. in this case we need to develop this indicator with "supporting" indicators.
      Separate your indicator pool in these breakdowns, it will be of great benefit.

      I tried to briefly explain the determining indicator, I would like to talk about supporting indicators in my next post.

      posted in Tutorials by Users
      P
      PhiLykia
    • RE: How to take profit using indicator

      https://fxdreema.com/shared/b96swwxEc
      Can you review it, maybe it will be a clue for the solution.

      posted in Questions & Answers
      P
      PhiLykia
    • RE: Editing and connecting boxes

      Write down your strategy step by step, and we'll help you build it.

      posted in Questions & Answers
      P
      PhiLykia
    • RE: Editing and connecting boxes

      While traveling, I use the chrome browser to answer questions, but as I said, it is impossible for me to use it this way. 🙂

      posted in Questions & Answers
      P
      PhiLykia
    • RE: Editing and connecting boxes

      It's really hard to edit on smartphones.tablet maybe.

      Since no strategy will be perfect, it is very useful to write and review as many examples as possible to develop different aspects of your strategy.
      For your strategy, you will never be able to say "okay now it's done".

      Strategies are like a novel, introduction, development and conclusion. should be given maximum attention to each. That's why I recommend making lots of examples and examining the results.

      If there is an open point, we will support.

      posted in Questions & Answers
      P
      PhiLykia
    • RE: How to use two macd indicators?

      will not be significant for the same time period.
      Things would change if the MACD was an on-chart indicator rather than a lower indicator.
      It is inconvenient to use the indicators on top of each other in a separate window.
      The MACD has two buffers that give two outputs, if you convert the indicator to 3 or 4 buffers with different periods, then you can strategize using intersections in the same time period.

      posted in Questions & Answers
      P
      PhiLykia
    • 1
    • 2
    • 3
    • 4
    • 2 / 4