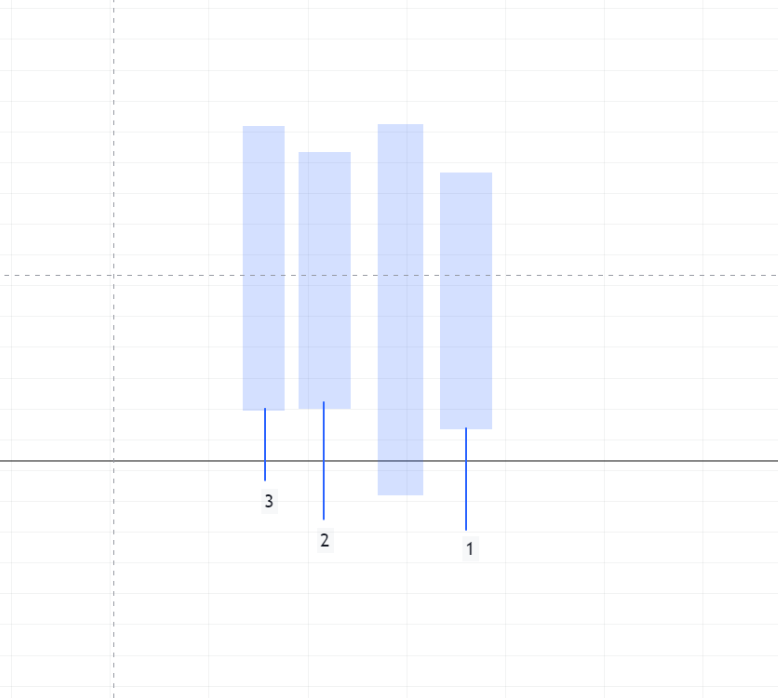
@PhiLykia it is to identify rejections.
and its can be either bullish or bearish candle - the only different is either upper wick or lower wick which in this scenario it is lower wicks.
@PhiLykia it is to identify rejections.
and its can be either bullish or bearish candle - the only different is either upper wick or lower wick which in this scenario it is lower wicks.
@ambrogio it is 3 wicks of 3 different candles.
@ambrogio I did this but its still not cutting it.
The idea is to draw the Lowest Low if 7 candles are away initial 7th candle.
Simply if the market drops 50 candles away and below from the initial 7th ID candle, the pink line should draw on the low of the lowest candle ID of that period.
So if candle ID 30 for the 7t initial candle is the lowest, and the price pulls up, the pink line should draw on the Low of the 30th candle and if the candle let say 45th then pulls below the 30th, that pink should move to the most recent lowest candle
the basic idea is to draw the pink line on the most recent lowest low 7 candles away from the 7th candle ID
So this is what I'm looking to acheive
@ambrogio I need your extending guide in this
I want to the pink line to draw to the lowest price from the ID 7 after the the ID 7 logic is filled. but in my case here it is not redrawing as expected look at the pic.
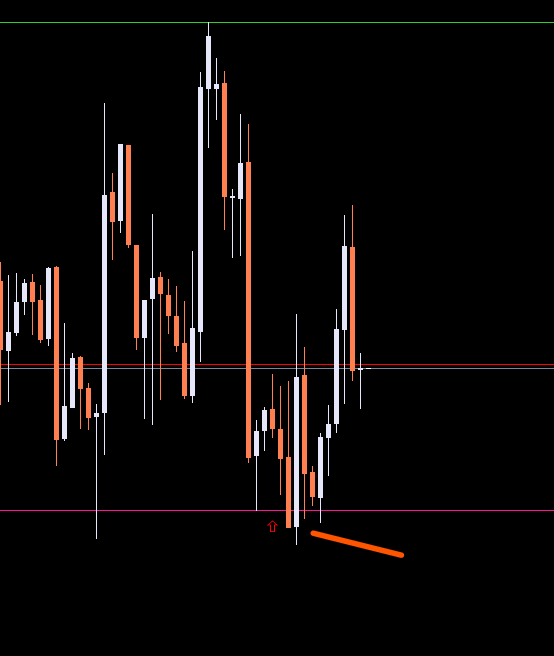
What adjustment am i to make it better?
https://fxdreema.com/shared/HVzVYKocc
because presently it only draws to the 7th lowest candle
@ambrogio i think this is the idea so once its up to 3, trigger open order
you have to create a variable that counts the number of times. When conditions are met once per bar modify variable count=count+1
Can you explain how show me how to go about this?
@ambrogio in this case I'm not counting consecutive wicks but the number of times it wicks through
for example, with it wicks through for 3 times, open a long position.
@ambrogio yes, but the logic is l want to count how many times that happened, in this case it happened 3 times, so how do i get that data value that the line as being wicked three times?
and also that the candle might not follow each other there could be 2 candles in-between the next wick
Hello, l want to have a logic that if price should wick above or below a line on chart as in the picture below, trigger an act maybe buy. It basically the ability to spot rejections around an area and the price does not have to follow each other.
How Can l do it? @ambrogio @l-andorrà @jstap @PhiLykia
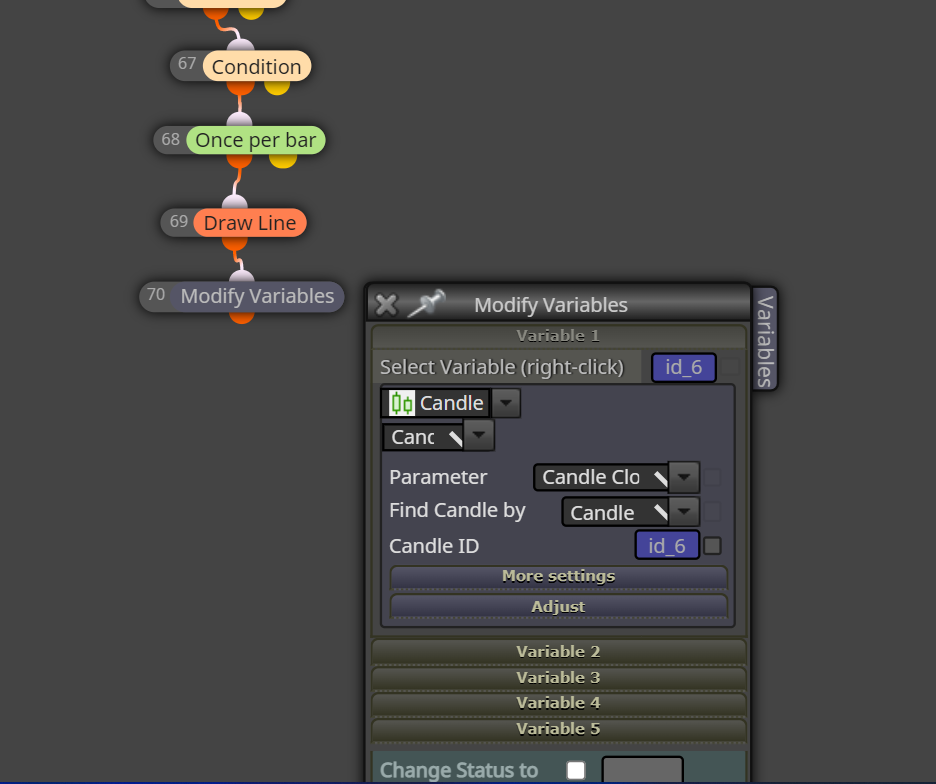
@ambrogio man, if l want to save the ID of Candle ID 6 for reference later, its gonna be like this right>?
@ambrogio ooh dear...Just imagine
Thank you so much
@ambrogio yes, I also separated it, still no luck. worse
What can l do about this?
@ambrogio I did but still no accurate
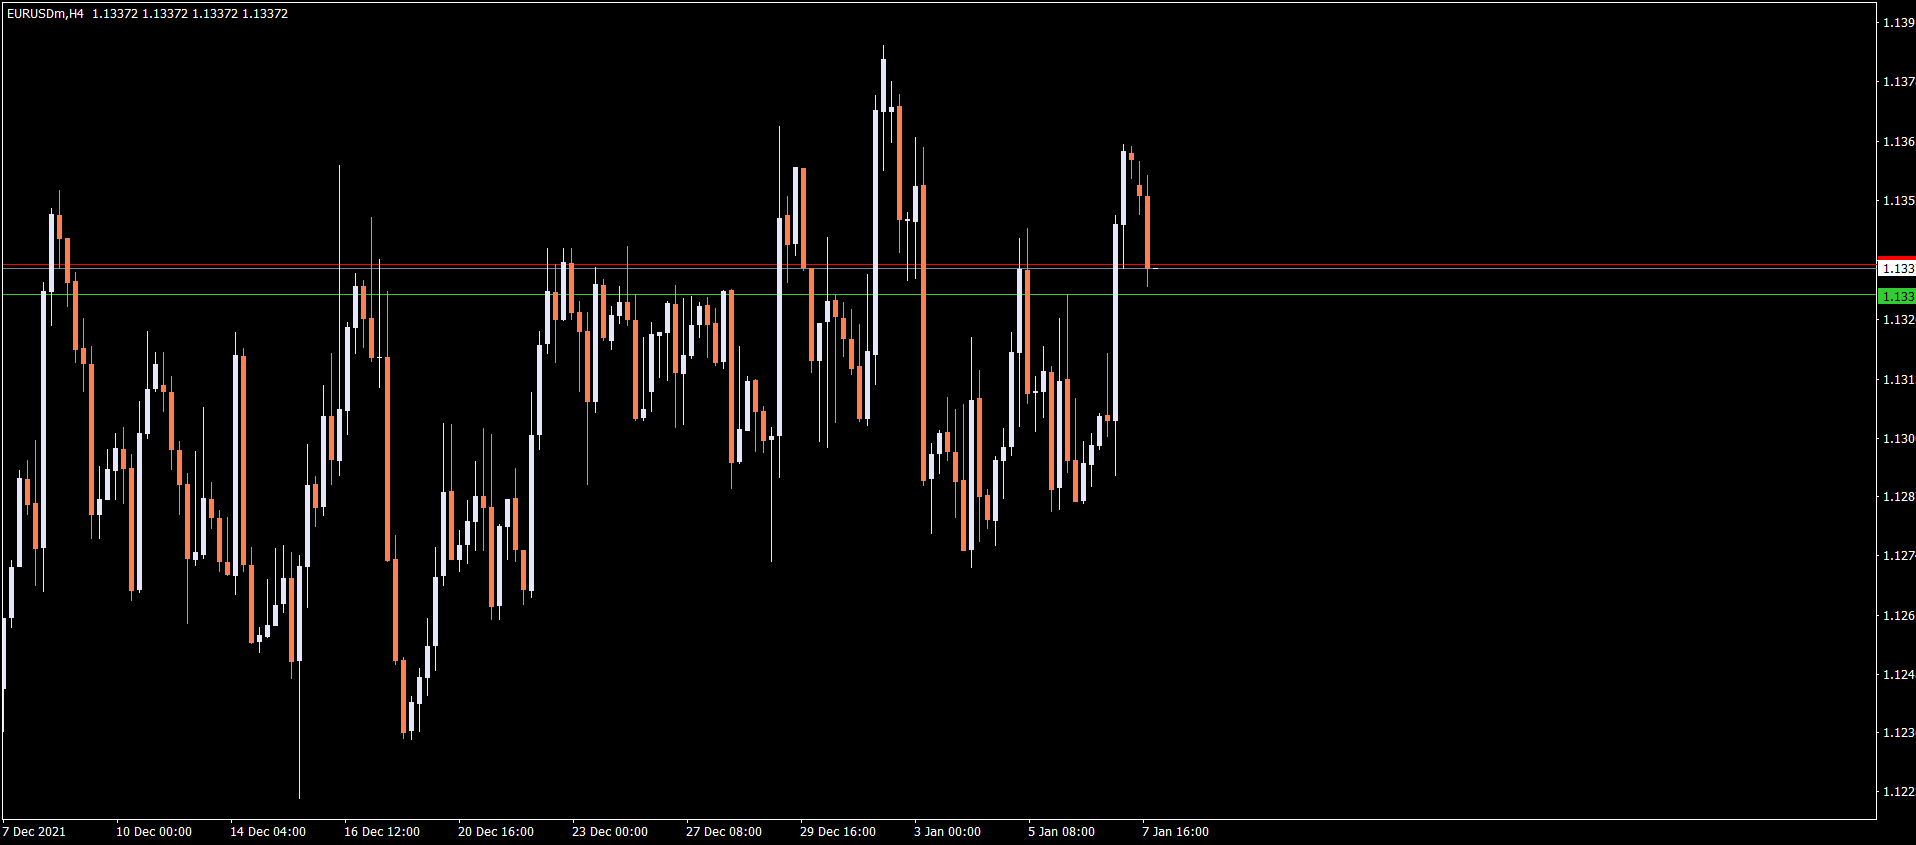
If you look at where the line is drawn here, we should have 6 candles to the left side but it stopped at ID 4 actually
@ambrogio I thought so too but its not drawing it correctly... at all
It draws even when the logic isn't filled yet.
and about the loop you mentioned? Can you help with it pls/?
The Logic is to draw a line on Candle ID 6 only if candle ID 6 is above ID 12 -7 and ID 5 - 0
@l-andorrà ooh..that simple?
Thanks
@alok hello, pls share me the project link that shows how you layered this
@justin15012 that's lovely.
Can you share the solution in a project format ?
@alok no, am trying to ldentify the HH HL LL LH of the ZigZags based on the options available in FxDreema
@alok I get what you're saying - but l meant something different