How to implement TDI indicator on fxDreema
-
Hello fxDreema Community,
I am currently working on developing an EA to automate my trading strategy within the fxDreema platform. However, I've encountered difficulties integrating the TDI indicator into my EA due to only having the .ex4 file and not the .mq4 file for the indicator. Despite configuring the variables and buffers manually within fxDreema, the EA is unable to detect or read the indicator properly.
Below you can see the indicator's settings:
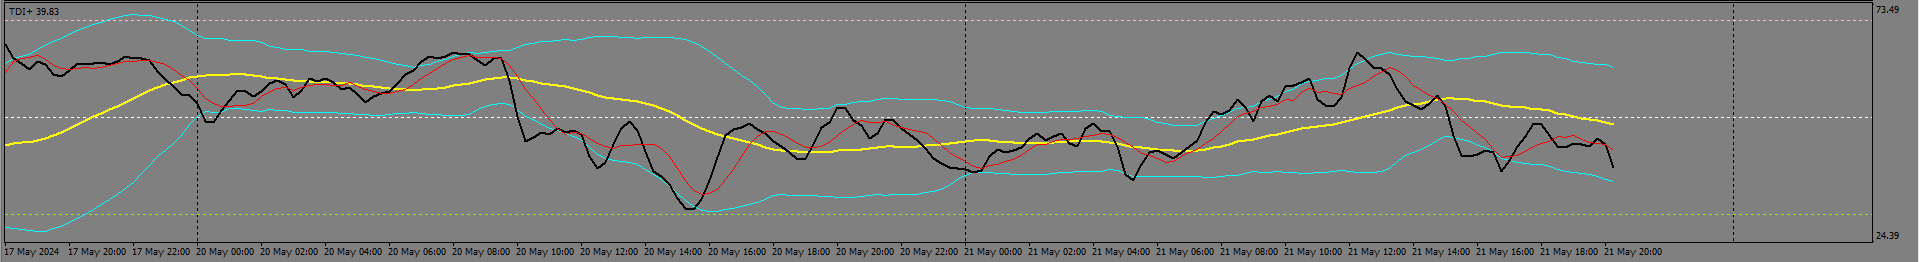
TDI+ (Custom Indicator)
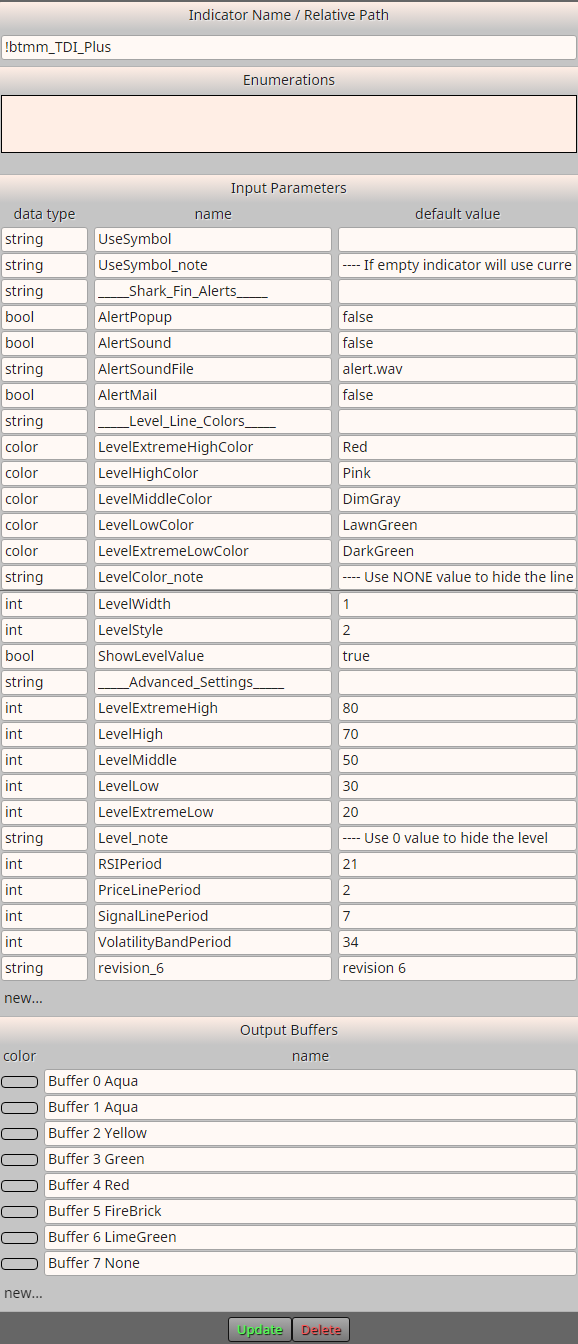
Inputs (Variables/Values)

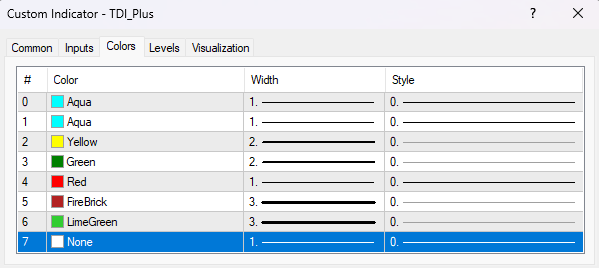
Colors (Buffers)
EA: fxdreema.com/shared/MMxZy8GKd
I'm seeking assistance from the community. If anyone has experience with integrating custom indicators into EAs within fxDreema or can provide guidance on this issue, I would greatly appreciate your support. Additionally, if there are alternative approaches or suggestions for building the TDI indicator within fxDreema, that would be the best approach I believe.
Feel free to reach out to me directly or reply to this post if you're able to assist or have an questions.
Thank you for your time and assistance.
Best regards,
Chandler -
Have you got the values in the data window?
-
@jstap
This is the only piece of info shown in the data window for the TDI+ Indicator:
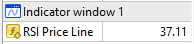
-
@Chandler So it's BB+RSI+MA. I'm thinking maybe you can just use standard indicator, understand and play with it.
-
@biztet
To provide some more context the TDI Indicator is made up of 3 separate indicators combined into one resulting in an advanced indicator.
It consists of:
1. RSI
Period: 13 or 21
Apply To: Close
Levels: 32, 50, 68
Color: None2. Moving Average
Period: 2
Method: Simple
Apply To: Previous Indicators Data
Color: Black3. Moving Average
Period: 7
Method: Simple
Apply To: Previous Indicator's Data
Color: Red4. Bollinger Bands
Period: 34
Deviation: 1.618
Apply To: First Indicator's Data
Color: Aqua5. Moving Average
Period: 34
Method: Simple
Apply To: First Indicator's Data
Color: Yellow -
-
@jstap @biztet Thank you both for your insights.
Given your advice, it seems that the EA needs to access these values via buffers from the indicator. Unfortunately, I only have the .ex4 file and not the .mq4 file, which complicates things. Do you have any suggestions on how I might obtain a custom version of the TDI indicator that includes accessible buffers? Alternatively, if there are standard indicators or other methods within fxDreema that can replicate the TDI's functionality, I'd be eager to explore those options as well.
I appreciate your guidance and any further assistance you can offer.
-
Google is how I would search for it, you can use the EX file but if the values aren't in the data window you can't use it.
-
@jstap Thank you for the suggestion. I actually found my way here through searching Google. Nonetheless, I appreciate your advice and will continue to explore available resources. If anyone has further insights or alternative suggestions, I would be grateful for your assistance.
-
@jstap @biztet Thank you for the clarification. Do you have any suggestions on how to work with the standard indicator within fxDreema? Since the TDI indicator is built upon the RSI indicator, is it possible to configure and extend the RSI functionality directly within fxDreema? Any guidance on this would be greatly appreciated.
-
You'll have to check this, thank chat gbp if works:
//+------------------------------------------------------------------+
//| CustomIndicator.mq4 |
//| Copyright 2024, MetaQuotes Software Corp. |
//| https://www.mql5.com |
//+------------------------------------------------------------------+
#property indicator_separate_window
#property indicator_buffers 6
#property indicator_color1 Black
#property indicator_color2 Red
#property indicator_color3 Aqua
#property indicator_color4 Aqua
#property indicator_color5 Yellow
#property indicator_color6 Blue// Indicator buffers
double rsiBuffer[];
double ma2Buffer[];
double ma7Buffer[];
double bbUpperBuffer[];
double bbLowerBuffer[];
double ma34Buffer[];// Input parameters
input int rsiPeriod = 13; // RSI period: 13 or 21
input int maPeriod1 = 2; // MA period 1: 2
input int maPeriod2 = 7; // MA period 2: 7
input int bbPeriod = 34; // Bollinger Bands period: 34
input double bbDeviation = 1.618; // Bollinger Bands deviation: 1.618
input int maPeriod3 = 34; // MA period 3: 34//+------------------------------------------------------------------+
//| Custom indicator initialization function |
//+------------------------------------------------------------------+
int OnInit()
{
// Indicator buffers mapping
SetIndexBuffer(0, ma2Buffer);
SetIndexBuffer(1, ma7Buffer);
SetIndexBuffer(2, bbUpperBuffer);
SetIndexBuffer(3, bbLowerBuffer);
SetIndexBuffer(4, ma34Buffer);
SetIndexBuffer(5, rsiBuffer);// Indicator lines
SetIndexStyle(0, DRAW_LINE);
SetIndexLabel(0, "MA(2)");SetIndexStyle(1, DRAW_LINE);
SetIndexLabel(1, "MA(7)");SetIndexStyle(2, DRAW_LINE);
SetIndexLabel(2, "BB Upper");SetIndexStyle(3, DRAW_LINE);
SetIndexLabel(3, "BB Lower");SetIndexStyle(4, DRAW_LINE);
SetIndexLabel(4, "MA(34)");SetIndexStyle(5, DRAW_LINE);
SetIndexLabel(5, "RSI");// Levels for RSI
IndicatorSetInteger(INDICATOR_LEVELS, 3);
IndicatorSetDouble(INDICATOR_LEVELVALUE, 0, 32.0);
IndicatorSetDouble(INDICATOR_LEVELVALUE, 1, 50.0);
IndicatorSetDouble(INDICATOR_LEVELVALUE, 2, 68.0);IndicatorShortName("Custom Indicator");
return(INIT_SUCCEEDED);
}//+------------------------------------------------------------------+
//| Custom indicator iteration function |
//+------------------------------------------------------------------+
int OnCalculate(const int rates_total, // size of the price[] array
const int prev_calculated, // bars handled on a previous call
const datetime &time[], // Time
const double &open[], // Open
const double &high[], // High
const double &low[], // Low
const double &close[], // Close
const long &tick_volume[], // Tick Volume
const long &volume[], // Real Volume
const int &spread[]) // Spread
{
int limit = rates_total - prev_calculated;
if (limit > rates_total - bbPeriod - 1)
limit = rates_total - bbPeriod - 1;// Calculate RSI
for (int i = 0; i < limit; i++)
{
rsiBuffer[i] = iRSI(NULL, 0, rsiPeriod, PRICE_CLOSE, i);
}// Calculate MA(2) on RSI
for (int j = 0; j < limit; j++)
{
ma2Buffer[j] = iMAOnArray(rsiBuffer, rates_total, maPeriod1, 0, MODE_SMA, j);
}// Calculate MA(7) on MA(2)
for (int k = 0; k < limit; k++)
{
ma7Buffer[k] = iMAOnArray(ma2Buffer, rates_total, maPeriod2, 0, MODE_SMA, k);
}// Calculate Bollinger Bands on RSI
for (int m = 0; m < limit; m++)
{
double bbMid = iMAOnArray(rsiBuffer, rates_total, bbPeriod, 0, MODE_SMA, m);
double bbStdDev = StdDev(rsiBuffer, bbPeriod, m);
bbUpperBuffer[m] = bbMid + bbDeviation * bbStdDev;
bbLowerBuffer[m] = bbMid - bbDeviation * bbStdDev;
}// Calculate MA(34) on RSI
for (int n = 0; n < limit; n++)
{
ma34Buffer[n] = iMAOnArray(rsiBuffer, rates_total, maPeriod3, 0, MODE_SMA, n);
}return(rates_total);
}//+------------------------------------------------------------------+
//| Custom function to calculate standard deviation |
//+------------------------------------------------------------------+
double StdDev(const double &array[], int period, int start_index)
{
double sum = 0, mean = 0, stddev = 0;
for (int p = 0; p < period; p++) // Use a different variable than 'i'
{
sum += array[start_index + p];
}
mean = sum / period;
for (int q = 0; q < period; q++) // Use a different variable than 'i'
{
stddev += MathPow(array[start_index + q] - mean, 2);
}
return(MathSqrt(stddev / period));
}
//+------------------------------------------------------------------+ -
@jstap Thank you for sharing the code! It's fantastic to see that the data window is able to pick up the values, which allows fxDreema to properly read a custom indicator. I appreciate the guidance.
The only issue I'm encountering is that the RSI levels are not being picked up. However, thanks to your help, I now have a better understanding and will try to configure it accordingly.
If there's any option to build on the RSI within fxDreema to enable it to directly read all the values, including the RSI levels, and eliminate the need for a custom indicator within the EA, that would be amazing.
I'm relatively new to the forum and fxDreema. While I'm beginning to understand how indicators work within the platform, I don't yet have the expertise to create and implement them in an EA. Any additional advice on this would be greatly appreciated.
Thank you again for your support!
-
Ask any question and I'll help you with what it does, there is too much to try and explain it all. In most blocks, you can select RSI indicator, the value from this is the current line value
-
@Chandler if you have no need to change the setting, maybe you can just use the ex4 itself and the buffer which i can see there is no black color, just dark green.
-
@jstap Thank you for the offer to help! I have a specific question: How can I configure fxDreema to read and use the RSI levels directly in my EA (example the RSI crosses above the static (RSI Level 50))? I've been trying to work with the custom TDI indicator, but integrating the RSI levels would simplify things greatly.
-
@biztet Thank you for the suggestion. If I understand correctly, you're saying I might be able to use the .ex4 file directly with the buffers as they are? The reason for the dark green instead of black might be because I changed it, not realizing it should match the original indicator exactly.
I've added the original indicator without any changes to it, but it's still not working. Could you clarify how I can ensure the buffers are correctly identified and used in fxDreema when working with the .ex4 file? Any specific steps or settings I should be aware of?
EA with Original TDI Indicator and Input Parameters and Output Buffers settings: fxdreema.com/shared/WEMw78nCd
-
From the link i can see you're trying to trade when green and yellow crossing, right? U will use buffer 2&3, and the condition will be
2 x> 3 || 3 x< 2, candle id = 1.Unless, the buffers doesn't stick at its possition. Eg. You can cross MA with BB lines at main chart, but crossing BB with MA@RSI will not happen correctly.
-
@biztet What I'm trying to do is:
BUY Condition:
Yellow Line is above the static RSI Level 50
Green Line is above the Red LineSELL Condition:
Yellow Line is below the static RSI Level 50
Green Line is below the Red LineHowever, since I cannot detect the static RSI Level 50 within the buffers, I first want to see if it can detect
3 x> 4 || 3 x< 4, with candle id = 1, when the Green Line is above (buy)/below (sell) the Red Line, which it doesn't seem to do.Could you also clarify what you mean by "buffers don't stick at their position"? The indicator opens as a separate indicator window and not on the main chart.
I appreciate any additional advice you can provide.
-
@Chandler You can separate the RSI if you need to use the level.
About that "sticky" thing, you can test by placing standard RSI+MA in the same window, and then move it left right left, watch the lines crossing, then you'll understand what i mean.
-
I've recreated the TDI Indicator to output all necessary values (visible in the data window) and set the buffers accordingly, as @jstap mentioned that the values must be printed in the data window for an indicator to work on fxDreema. I have tested it within the EA: fxdreema.com/shared/FRlDp0V5
Is there a way to visually test when trades are being placed, like showing an arrow each time all conditions are met and a trade is executed? I currently have no way to confirm if the EA is working as expected. Additionally, it doesn't seem to be functioning correctly on certain days during my tests.
I'm testing it on MT4 via the Strategy Tester Window. Is there something I might be missing or doing wrong? Any advice would be appreciated.