@Jstap Thank you very much for all your input .. I have this problem solved now.
I had to connect both sides of the algorithm to the Check trades block
@Jstap Thank you very much for all your input .. I have this problem solved now.
I had to connect both sides of the algorithm to the Check trades block
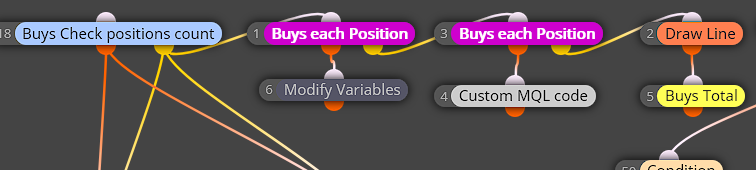
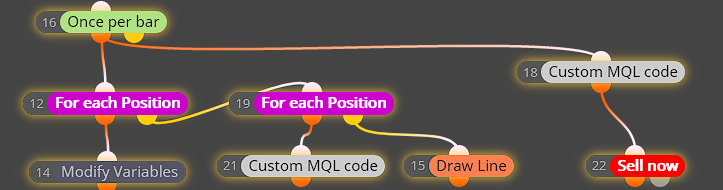
@jstap Ok, I understand that you will be lost if you did not run the expert to see everything that I explained above happening. I understand that the advice that you have given is the correct advice in normal circumstances, but it will not work because in this instance the the Buy side and the Sell side use the same MQL block. This is the biggest problem.. would you do me a favor please.. Rewrite the Sell part of the expert using the same blocks but with other variable names and such. I have also done this in Group1 and Group2 but I struggle for the expert not to use the MQL block simultaneously for Buy and Sell,
@jstap .. brother, I do not care about how many trades the expert makes because I have that covered. My problem is with the mistakes the algorithm
starts having, if you take sells and buys together. I have gone so far as to create groups as to help the workings not get mixed-up but it does not help, it still mix-up the buys and sells average.
If I create ONLY buys then the averaging algorithm do not make mistakes and so also with ONLY sells, BUT, when the two works together that's where the algorithm starts making mistakes. So I need a way to keep the Buys and Sells apart. When there is a BUY condition the Sell side must be put off, and visa versa.
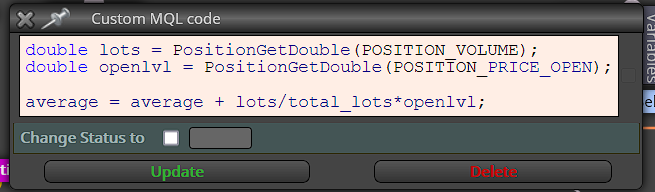
@jstap Thx for the reply... I cannot do that because the expert works on averaging.. so if I do the Check Block it will mess-up the count of the pips away from open price. Have you run the expert? Please check how it runs. There is a similar project on another project.. Let me check where it is
https://fxdreema.com/forum/topic/8947/can-i-set-my-buy-sell-ea-to-only-buy-or-only-sell
but I cannot use it here..
Hello
Because the modification of the Take Profit calculation get mixed up working with the sells and buys together I want to separate the sides... Buys only and sells only. In other words, When the buy condition is activated then ONLY the buy side will work and when Sell condition is activated ONLY the Sell side will work. The OR, AND and IF function does not work in this case, I already tried.
https://fxdreema.com/shared/qLh0njCEc
Regards and Thank you
@mr-lenny Start here... good luck
0_1647850511114_avg.ex5
https://fxdreema.com/forum/topic/11771/mathsrand-problem/2
Also check this thread:
https://fxdreema.com/forum/topic/10350/profit-math/66
@jstap Thx for taking a look... yes I know it complicated because I tried every setting to get the normal trndline setting to work as the indicator but to no avail... I think its a great indicator manually. I use it every day. I even tried to contact the owner of the indicator... got no reply.
The coder wrote this in the code.. maybe it can help:
//| Automatic trend lines. |
//| Type 1. With two extremums. |
//| 1) From the current bar "go" to the left and look for the first |
//| (right) extremum point with the InpRightExmSide bars on both |
//| sides. |
//| 2) From the first point again "go" to the left and look for the |
//| second (left) extremum point with the InpLeftExmSide bars on |
//| both sides. |
//| 3) Draw a trend lines. |
//| |
//| Type 2. With extremum and delta. |
//| 1) From the current bar "go" to the left and look for the second |
//| (left) extremum point with the InpLeftExmSide bars on both sides.|
//| 2) Starting with the InpFromCurrent bar from the current bar and |
//| to the second extremum point find the bar with minimal delta. |
//| 3) Draw a trend lines. |
//| |
//| NOTE: |
//| 1) The lines are recalculated only when a new bar appears |
//| 2) The current unformed bar does not included in the calculations|
//| 3) The extremum means a bar, for which the left and right |
//| N bars have minimums above and maximums |
//| below.
@biztet But this is standard indicators.. trend lines following the low and high of candles
And here I am struggling to get the pivot points on different time frames..
https://fxdreema.com/shared/x8NFtfjR
@biztet I am good... looks like you also doing well..How is your trading doing?
. I do not want to use object on chart it become tricky.. I have it setup in my metatrader but have to use like 5 timeframes to get the desired levels.. Will be better if I can have the code chaged or have an Icustom code to direct the expert to the indicator..
Look how much space this is taking as loaded in present.. like my whole computer

@alphaomega said in Trendline settings:
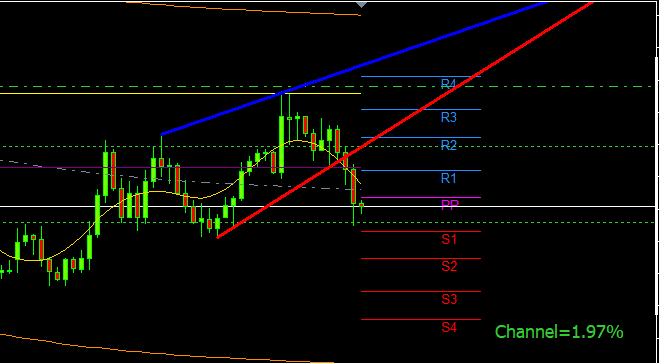
Could someone please help me understand how these settings in my trend line condition should be setup to match the picture?
My shared link https://fxdreema.com/shared/IuykC4Tmc
What I need is settings according to this picture:
And here is the Indicator:
0_1647364536420_Autotrendlines 3.mq5Thank you
Are there any coders in the house to help me here Please. I need the buffers set to the Trend line not the Sup and Res horizontal lines. It is not that much code. I am just to thick to know how to do it...
Pretty Please
@l-andorrà Thanks for the tip with the poivot points... Not sure about the repaiting part... could easily be because I have been playing with these settings for over a week and could not get it to compare. Naturally I must be to thick to understand it. Thanks for your reply, you are always a savior!
Could someone please help me understand how these settings in my trend line condition should be setup to match the picture?
My shared link https://fxdreema.com/shared/IuykC4Tmc
What I need is settings according to this picture:
And here is the Indicator:
0_1647364536420_Autotrendlines 3.mq5
Thank you
@tipsywisdom No sorry my nick on discord is pompies#1618 .. just invite please ...
@tipsywisdom Thx for taking the time to check out my error... I made sure that the Horizontal line is considered in the condition.. I have not worked on it again because I found another error in my expert and is trying to sort that out for the moment.
I have search many threads already looking at examples to fulfill my strategy and I could,ve stumbled upon yours.. not sure. Could you give me the name of your thread with the trend line variables?..... but my biggest inspiration of using trend lines is miro1360 and roar. I especially want to use roar exploratory trend lines. There is so much information in these vaults of Fxdreema. Wish I had more time to get at least one expert perfect.
Thank you once again
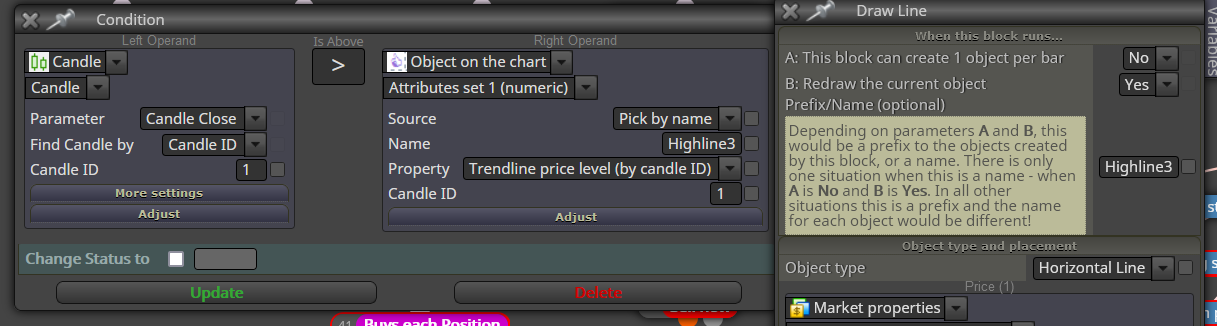
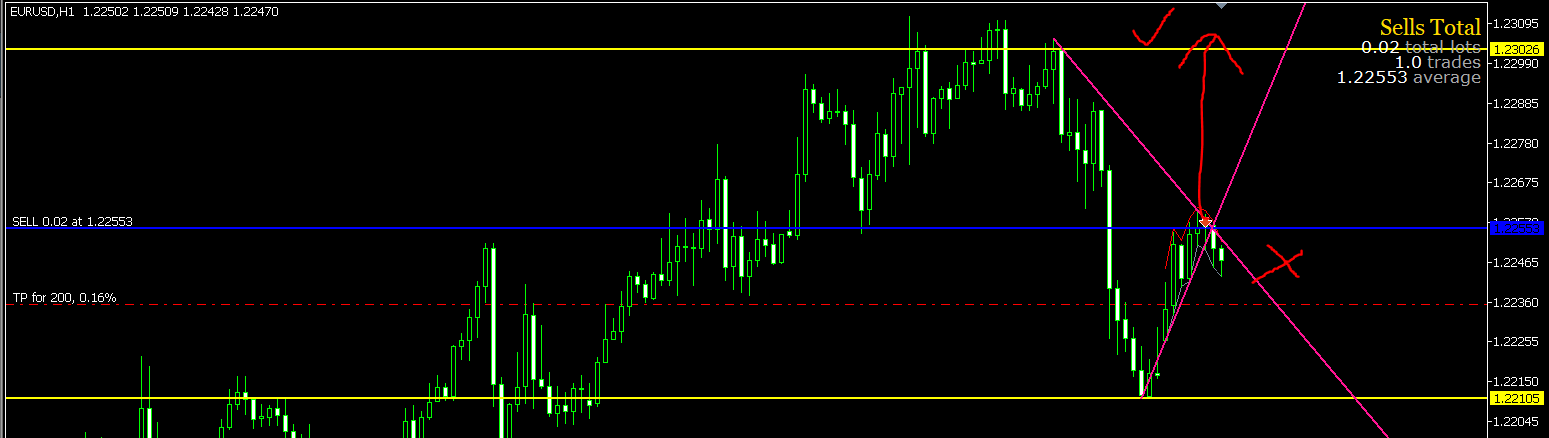
Can anyone check this please, What am I doing wrong here?
If A is YES and B is NO, I can use this as a name. So, Is my condition wrong, because the expert keeps on put the sellorder on the wrong place? The condition says wait and put the order above the Highline3
@l-andorrà Lol.. yes.. want to test when 3rd dot appear to place order
@l-andorrà Thanks for the replay... I want every 3rd dot appearing for the moment.
I read this strategy from a woman at FBS .. She reckons 90% profits... I am not sure its that good so I want test it myself.. maybe it will help someone else here also
Time frame H1 For buys
MA9 above MA50
RSI above 50
Parabolic SAR when third dot appear
https://www.youtube.com/watch?v=mel1Pq4McT8
@ambrogio You are correct ... my apologies!!
@ambrogio I totally agree with you, but you cannot say ID0 does not exist. @jordanburch is working on M1 chart so the ID0 will play an important role considering where PA is moving. He should consider using MA-crossover or candle volume to bring the ID0 into play?
edit:
This is ID0 orders... the current candle is still deciding where to go. IMO I think its important when using time frame M1 to consider ID0 in finding the HH or visa versa
