@l-andorrà
You can optimize the SMA_MODE the first way jstap showed you.
Set -> start value : Simple
stop value : Linear weighted
And the optimizer will go through all SMA_MODE. Just the optimization will be a bit messy as it isn't a quantitative parameter.
S
Best posts made by seb 0
-
RE: What am I missing with ENUM variables for MT5?posted in Questions & Answers
-
RE: Backtesting, lets talk about it!posted in General Discussions
@TipsyWisdom
Yes I was serious, predetermined stop levels(SL-TP) are problematic when not on ticks modelling. Or it is more problematic because there will always be inaccuracies in the tester compared to live anyway, even on ticks.
But on 1m OHLC, the code is executed every OHLC points, that are pretty far each one from each other.
So, except if by chance the next execution models the price at your exact stop levels, it will likely be exceeded by much. And I don't know exactly how but the tester in these cases "correct" this gap rather in your direction.
Such a way that if you traded randomly with stop levels on OHLC modelling, you would be winning.
To overcome this I advise, instead of using predetermined stop levels, using conditions :
Not -> buy(TP=1.2)
But -> buy(no TP) , and if price is above 1.2 next OHLC execution close it. -
RE: Anyone know where @roar went?!posted in Questions & Answers
@iceyheart
On holiday his EA is doing the job ; ) -
RE: Profitable test results on Falcon and Condor, and forward testing looking goodposted in General Discussions
Try replacing buy trades with sell trades and vice-versa, so it will be the exact opposite strategy. If it is still profitable that's a bug.
-
RE: Profitable test results on Falcon and Condor, and forward testing looking goodposted in General Discussions
@Ipod
I haven't investigated how it works exactly but : In live the stop levels will be placed on the broker sever side, and the price will be modeled based on them(based on the stop level that will be triggered). When you use stop levels on the tester, the price is modeled discontinuously(as live), independent of these stop levels. Then on the tester the price jumps from one point to another that are never(almost) exactly at the level of these stops. And here I lack knowledge, I don't know if it's enough that one stop level gets triggered, and if it's a TP it will be at the level above(level of price modeling), if it's a SL at its exact level. Or if it must trigger both stop levels and then it will always consider the TP was triggered first.
I think roar knows. -
RE: Flags switching valueposted in Questions & Answers
@roar
@l-andorrà
You right i managed to do with variables in 30 minutes, what i was trying to do with flag since few days..
Thanks for the advice -
RE: Serious bug with Fibo retracementposted in Bug Reports
@l-andorrà
I think you are just using fibo parameters wrongly. As you can see fibo levels are between 0 and 32. It is the ID if each level, not the value it self. So if the reference level is 100%, try to set : Property = price by level ; Fibonacci level = 6.
Level 100 doesn't exists thats probably why it returns a 0 value. -
RE: Generate a random chartposted in General Discussions
@roar
Even though, my knowledge in the domain is very poor, i saw your topic and i couldn't avoid making the link with a formula i've seen recently about reproducing sort of chaos, it is :
X=4.x(1-x) with x between 0 and 1, both excluded, and replacing x by the results in the next operation, and
so on, as a mathematical series.
Not sure you can reproduce a 100% random chart, when even this exemple has his rule, it would give something crazy. I think youll be able to use this pretty simple equation in excel without any problem. -
Another trend line projectposted in Tutorials by Users
First time i'm posting in this section, just wanted to share with you my project drawing trend lines.
It draws dynamic support resistance lines, on higher lows and higher highs, using RSI, and linear regression formula, to find best placement of the line.
This is one version of the project which as all can be indefinitely upgraded.. if you want to add something.
https://fxdreema.com/shared/jbgI13yne -
RE: Been wondering about this for a whileposted in Questions & Answers
@roar
Yes got it, pretty smart. Im gona consider it, it may be useful to me later! -
RE: just looking to collaborate.posted in General Discussions
The thing is, number of strategies used humanly are very hard/almost impossible to implement in a bot. The very visual ones like : triangles; retracements; support/resistance... require a complex analyse, only a brain is able to master, especially when they are combined.
Automated strategies are using often simpler signals, like crossing ; specific value at a given time for exemple, in sum more binary things.
But i don't think you can come out profitable using such easy and common signals taken one by one. So you must find a system that allows you to combine several simple signals like these, but giving enough flexibility, to miss as less opportunities as possible. Like playing on lots size for exemple.
At least this is what i got since i'm on EA's, by that recently ^^ -
RE: EA dumpposted in Tutorials by Users
Dang i missed this topic!
That actually is really cool, i didn't get the netting method right, i thought it was the fact to accumulate the trades of a same type... Now it opens up many perspectives to me. If I don't have a netting account I still can simulate it with a simple close trades(sells when buy signal) block right ?
Your strategy looks pretty simple and effective. On a higher timeframe wouldn't the PriceMouvement/Spread ratio still give better results ?
Talking about that i just found a simple configuration that also seems to give good results. Here is what it is :The excessive value of the stochastic oscillator occurs when a price movement is significant compared to the recent range so
in a up trend ::::::
-the downward oscillation will not be overpassed by much by the recent range as soon as this trend is not too aggressive so the Stocha will be low. (fig 1)
-In this same situation the RSI will not go down by much because we are in a uptrend so the downward oscillations are hampered by the fact that we are in an up trend. (fig 1)
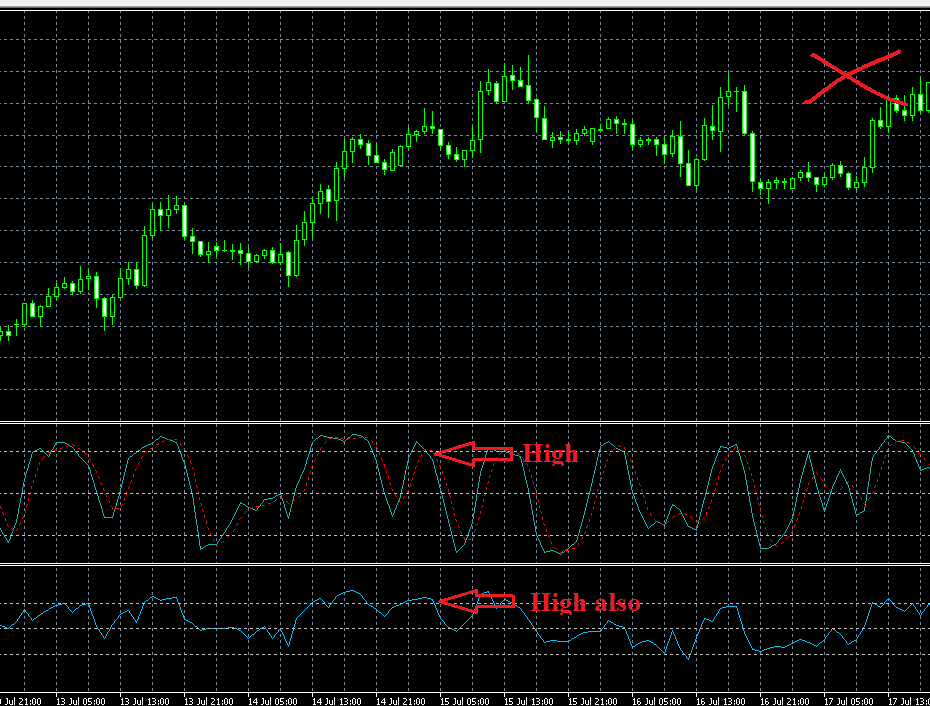
In a up trend :::::::
-the upward oscillations will make the Stocha oscillate as much(as the downward oscillations) (fig 2)
-however the upward RSI oscillations are gonna be amplified by the fact that we are in an up trend (fig 2)
Conclusion(mine) : The good signals should occur when the value of the Stocha is excessive, but not the one of the RSI.
The periods of the indicators need to be adjusted, and I added an minimum ATR value so the little price movements during flat market are not taken as signals.
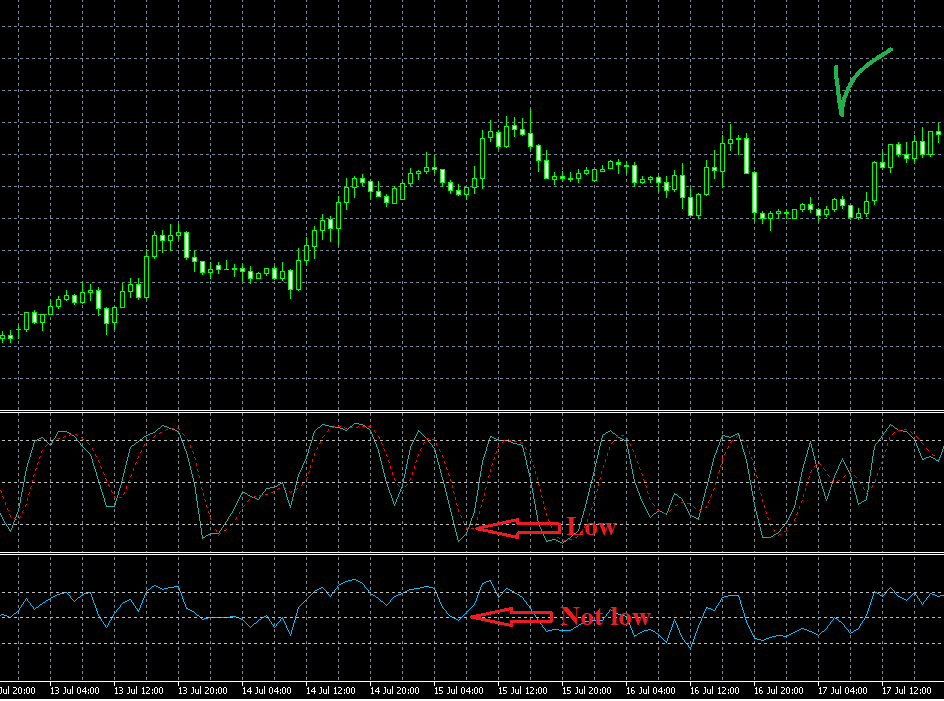
The good thing about the strategy is that the trend taken in count by the indicators divergence, is a really recent one, so the lag is really low.
https://fxdreema.com/shared/cYklE3lHc -
RE: Time filter blocks operationposted in Questions & Answers
@roar
Yes fortunately. Better the EA to be as much as you want it to working, before using it on real account.
The way you did it is quicker to build than mine, thanks for the exemple ^^
I hope this topic is gona help other newbies, ill try to stop opening new ones for a moment, you guys must be busy! -
RE: Strategy Results, Good? Bad? Okay?posted in General Discussions
Here are the results of my current EA.
I tested it on EURUSD, from 2000 to 2021, on timeframe H4, forward on 1/3.
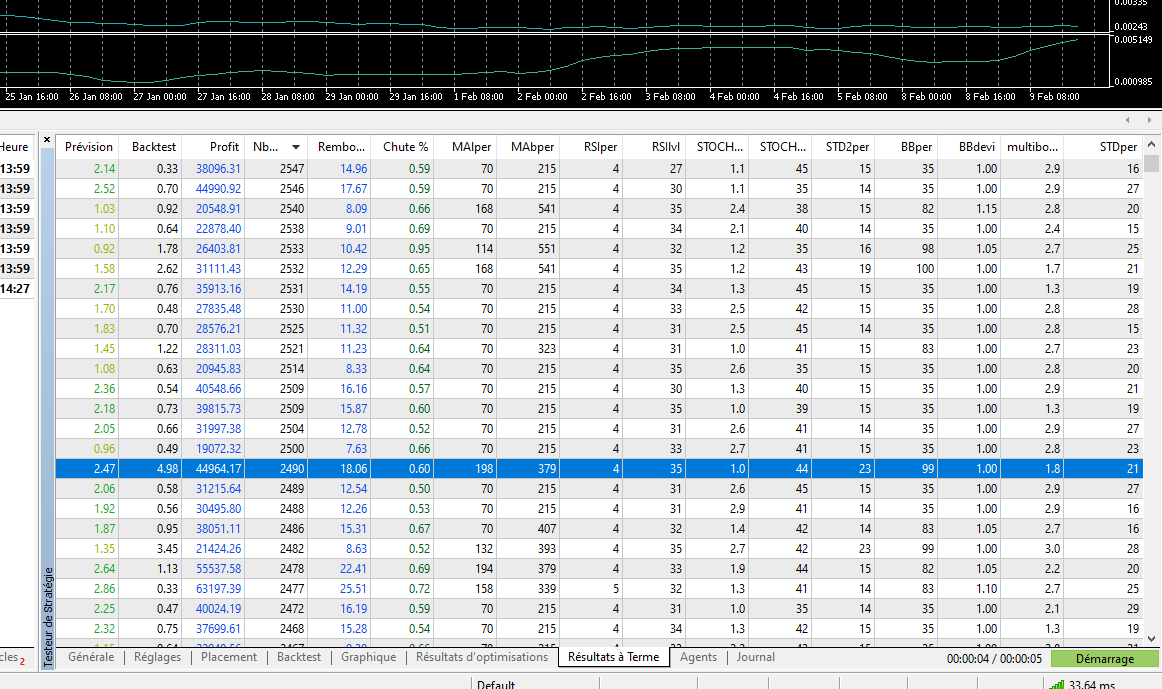
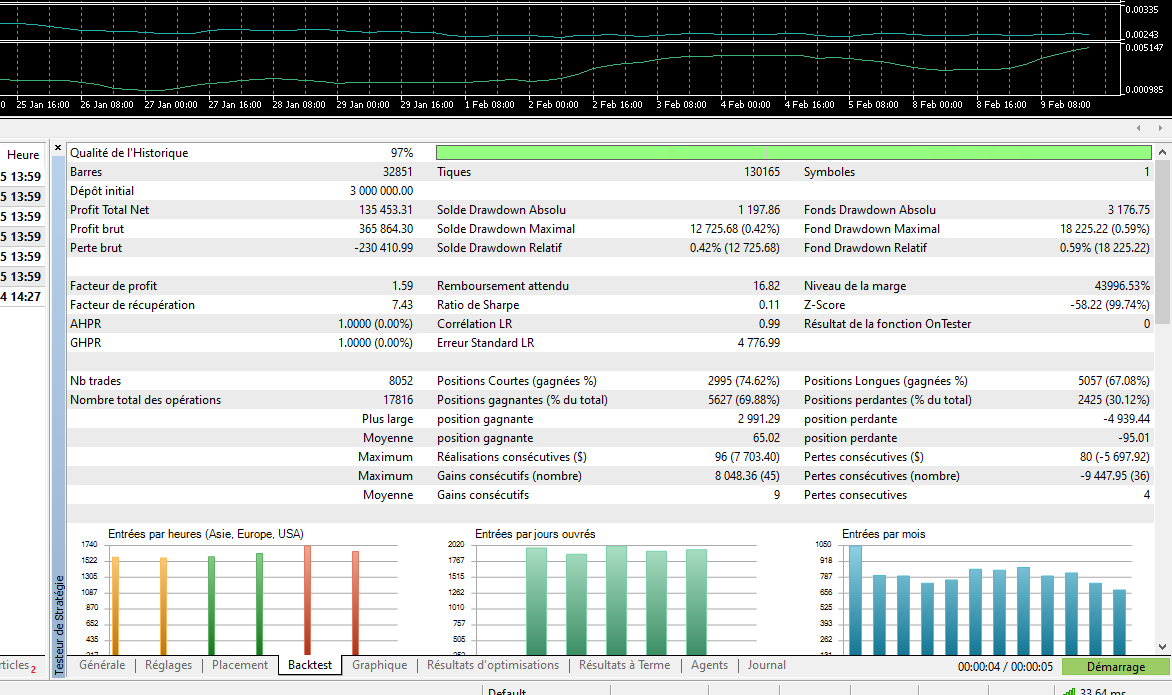
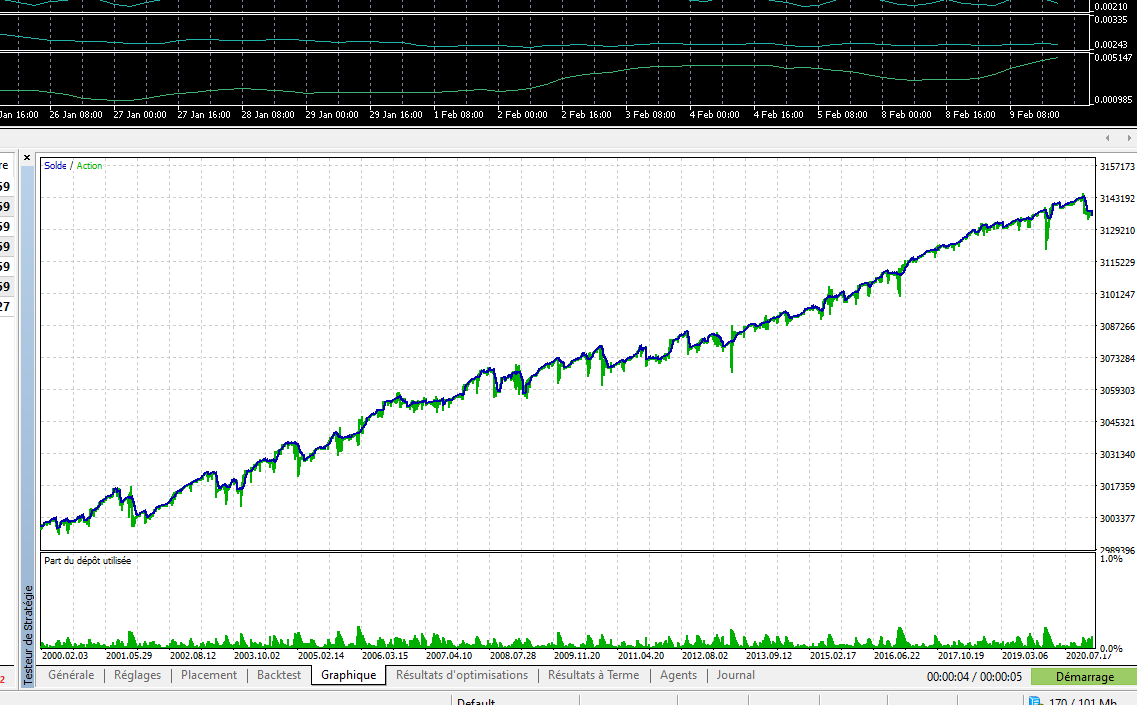
I think these are some pretty correct results because : I tested it on a long period; the number of trades is pretty important; and the majority of the backtest/forwardtest results were positive.
Just wanted to show you that")
-
RE: EA flexibilizationposted in Tutorials by Users
@l-andorrà
Yes Ill explain
In the custom blocks I am actually using the RSI formula. Because it converge to 100 that is the scale on which the score is expressed.-
The first line is 100-100/pow(pow((1+rsi-Rlvl),0.5),2), lets begin with 100-100/(1+rsi-Rlvl).
When the "rsi" value is getting important the value of the formula score is increasing also, the score so. Basically I applied the RSI formula to the RSI, I could just use the value of the RSI and interpret it as a score, but I needed it to be more sensitive in the extreme values.
The score is beginning to be positive when "rsi" is above Rlvl-1(lets say 55) only. And the RSI formula allows a non linear value variation(increases fast at the beginning then slower and slower).
Then I added the exponents : 100-100/pow(pow((1+rsi-Rlvl),0.5),2). Because when "1+rsi-Rlvl" is below 0 the score value is positive again and I don't want that. So with the exponents I achieved : (x^(1/2))^2 = x if x > 0, (x^(1/2))^2 = nan(ind) if x < 0 You can't square root a negative value -
In the second line : 100-100/pow(pow((1+k2*(-dif+atr)/atr),0.5),2 It's the same thing with a k2 coefficient parameter.
With (-dif+atr)/atr, when "dif" increases(ma100 is more above ma200), the score increases also. I just expressed the "dif" relatively to the "atr".
I also added "+atr" cause I want the score to begin being positive when ma100 slightly < ma200 because, when its the case on these periods, there still can be the MAs(ma50>ma500) reversed on a higher or lower period. And the more ma100>ma200, the more configurations of MAs will be in the same order, the bigger the score. -
In the third line : Same thing, with here, the [bottomWickSize relative to the bodySize] as "x" variable.
Then I am averaging it dividing by 3.
The thinking is the same for the opposite signals.
Finally I open a trade when the averaged score is above a certain threshold.
-
-
RE: Horizontal line movement (SOLVED)posted in Questions & Answers
The second block in your project "278" is checking a constant value, which by definition never changes, so it will never pass to the next ones.
Is that what you want ?
https://fxdreema.com/builder/shared/sNabVEZsc -
RE: Pre-Run EA in Live Market/ Start EA from past to also consider older price levels in Live Tradingposted in General Discussions
@umbrellamaker
You can do it with the "pass once" block on tick tab. Give it block id 1.
So your EA will have 2 entries : 1."pass once" and the other filter you choose like 2."once per bar". -
RE: EA flexibilizationposted in Tutorials by Users
@alphaomega
That is it you are on the way!
The middle brackets of the first formula are unnecessary actually.
I tried to explain how the formula is playing its role above, but it isn't easy to understand at first I know -
RE: Poor countries, poor peopleposted in General Discussions
It's unfortunate spending so much time in something that(beside will make you loose money) is useless. That's why I stopped trying to learn strategies that only apply to trading, and begun learning machine learning. Therefore I utilize the market data as a laboratory environment to develop my skills in this field, making a little money trading with it, with the view to export successful models to useful sectors like healthcare.