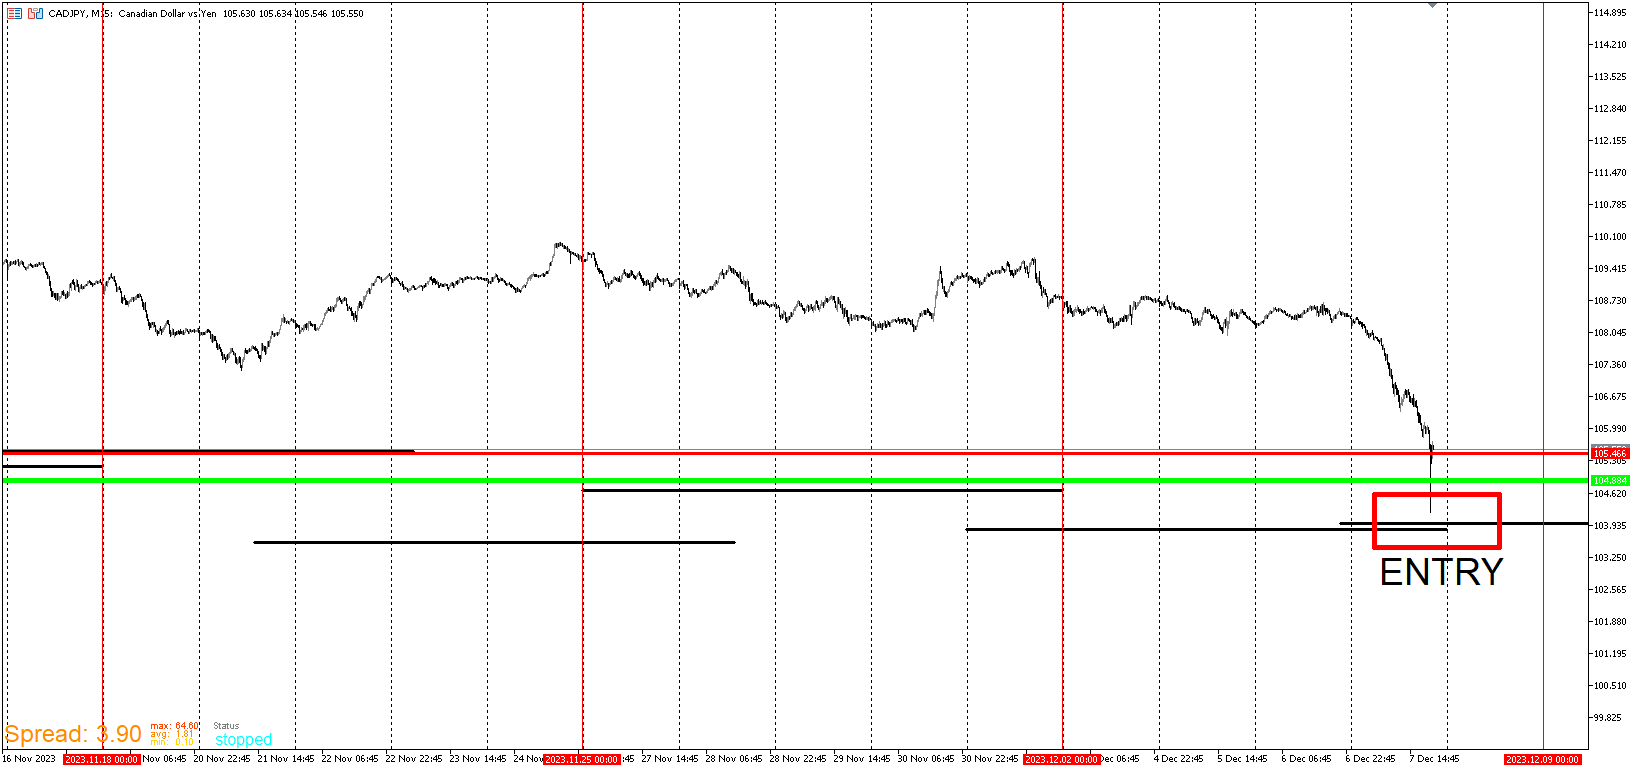
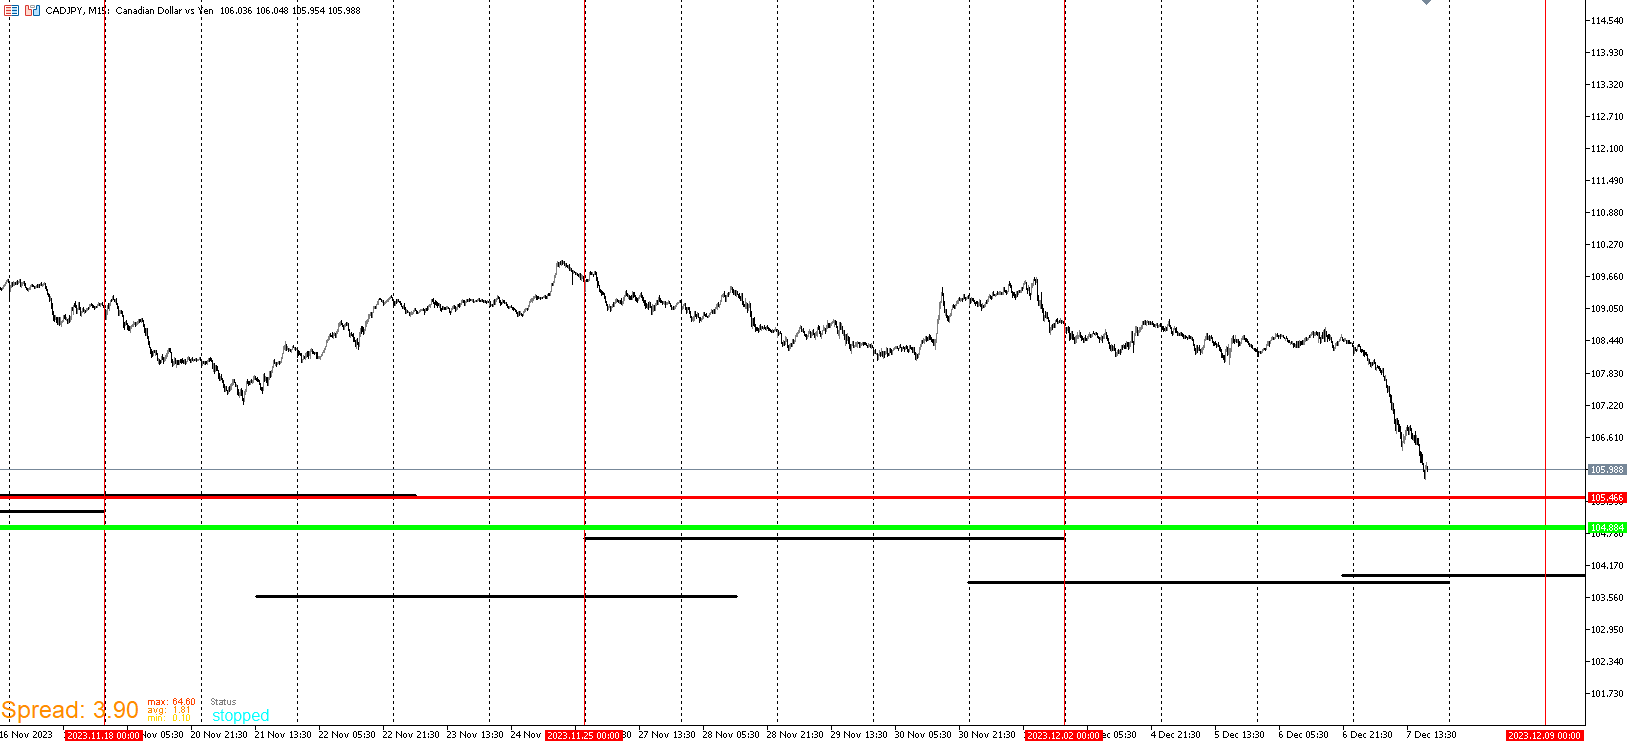
CAD/JPY
J
Posts made by JayPhillbrooks
-
RE: My EA updateposted in General Discussions
The move down came much quicker than I anticipated. I entered on every template. Good thing I was here posting and watching. I expected a grind down but historically spikes like that on these templates are promising buys. I still could be wrong. These are the setups I wait for.
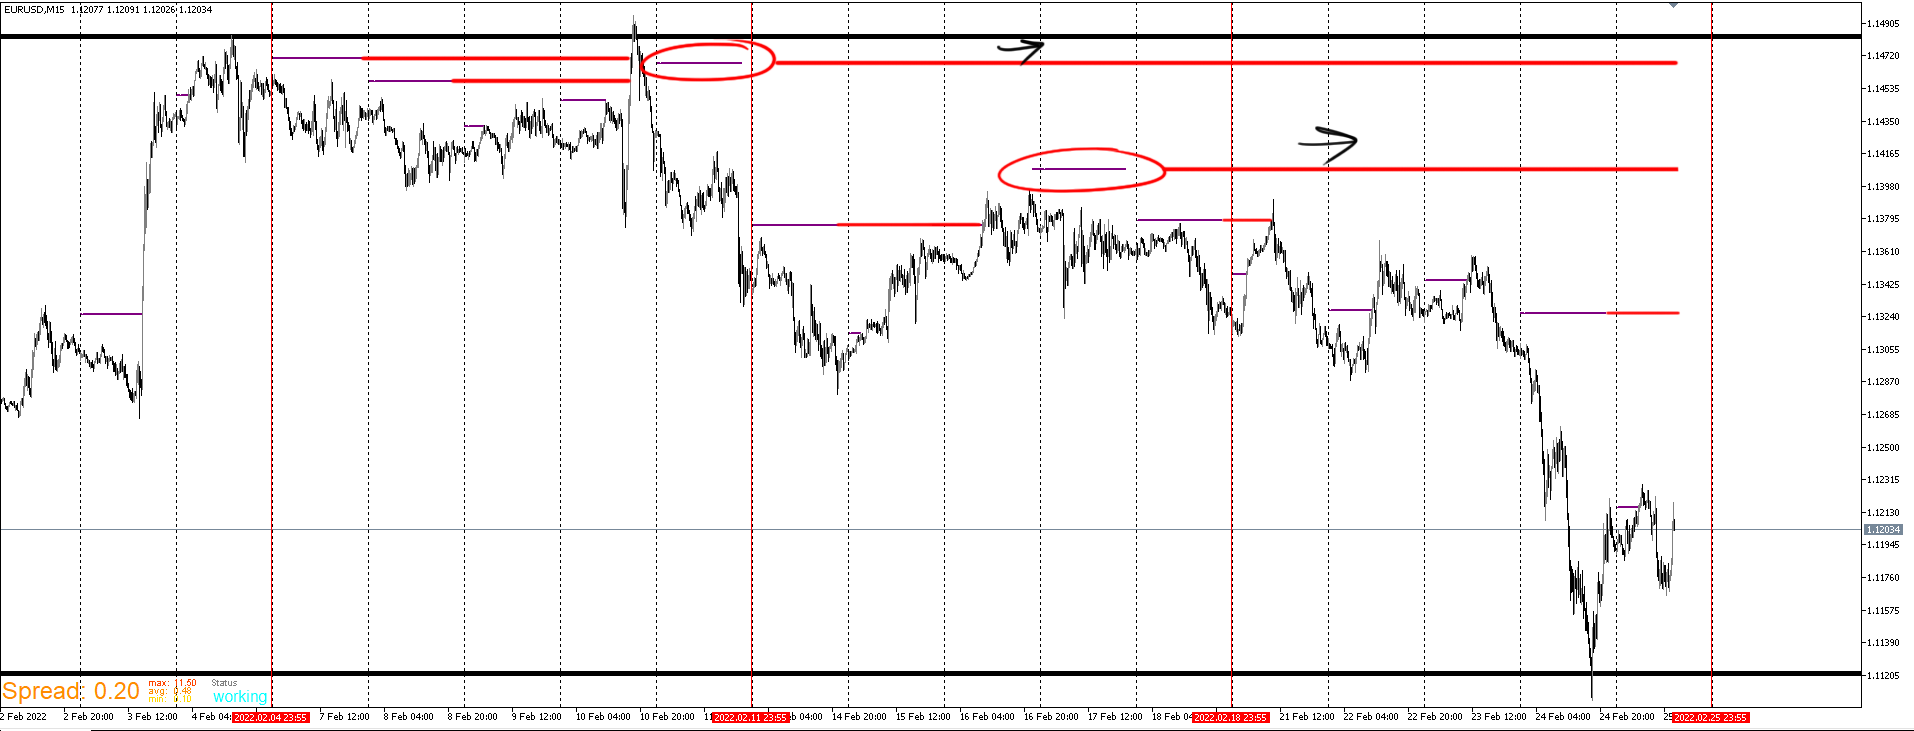
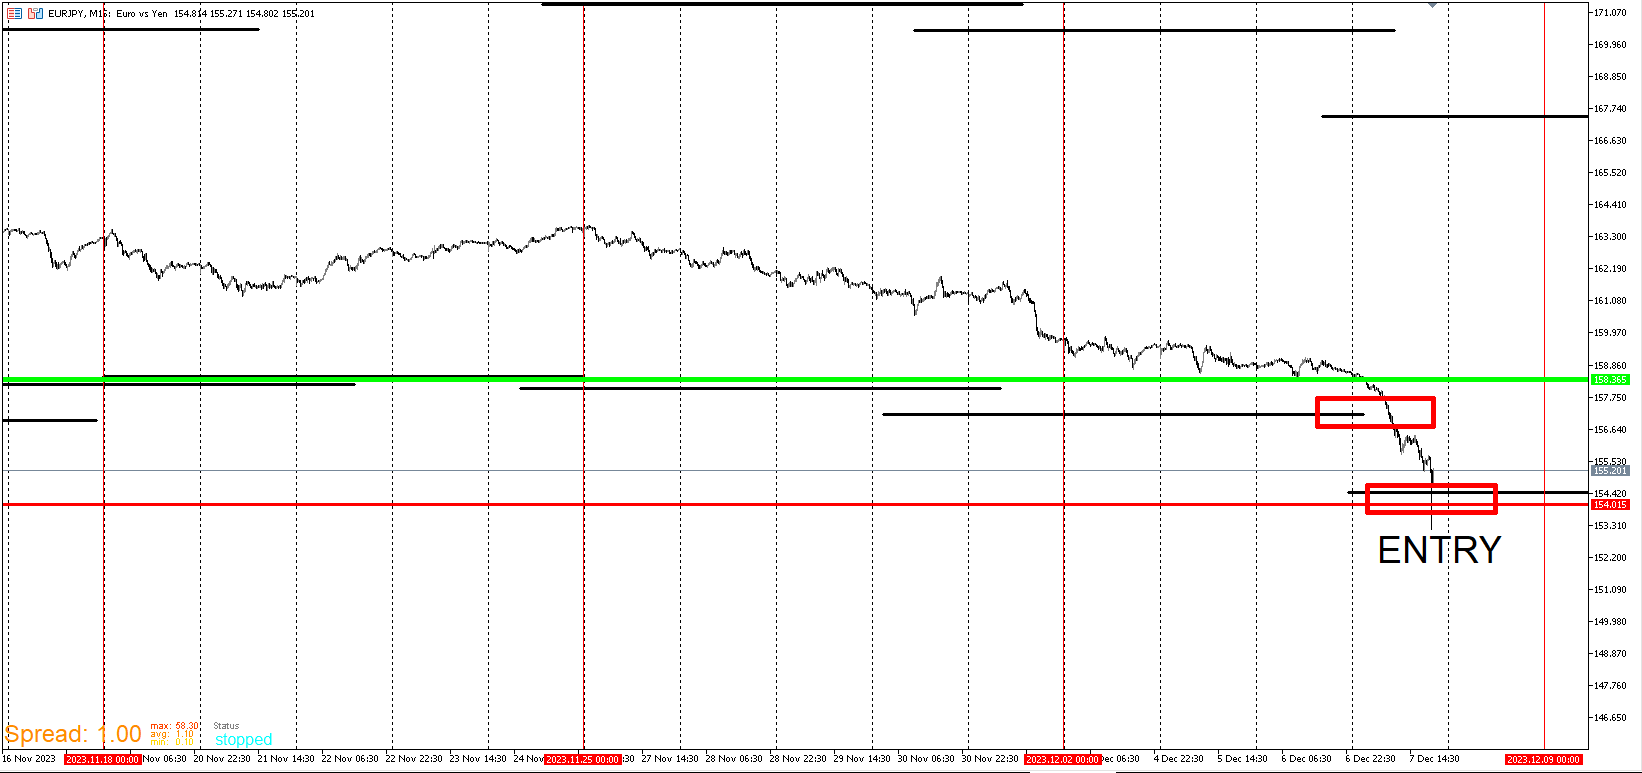
USD/JPY
-
RE: My EA updateposted in General Discussions
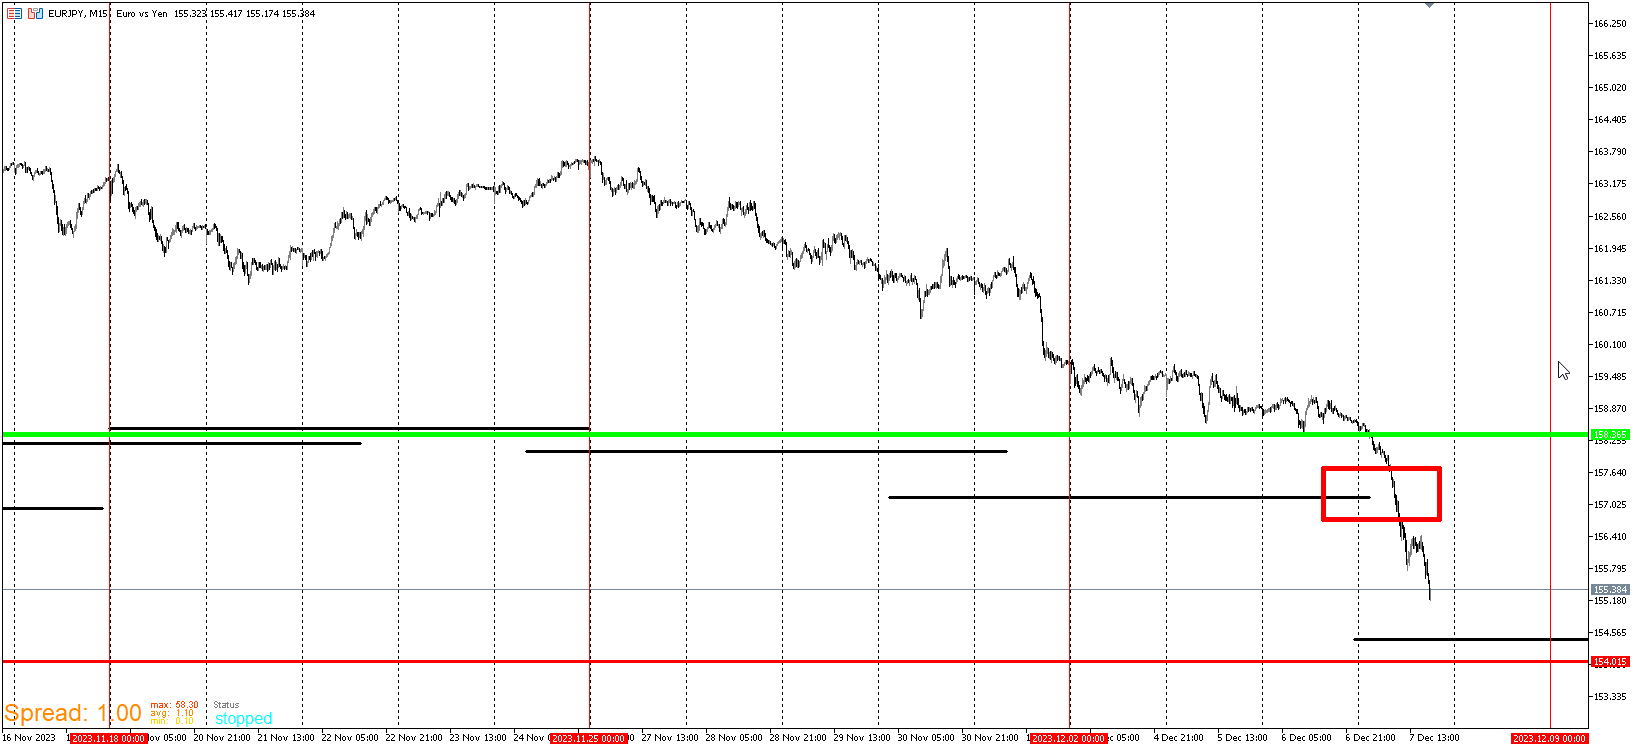
Here is EURJPY. I included Template 3 Buy interest zone. I forgot to include in USD/JPY. The green like there is the entry. Anywhere near or under the red is where I become more interested in entering. The Red line is a separate Template and I will explain it later. It's another major Template I pay attention to overall. Remember, I like to see some time go by under the green line. I prefer at least two days and a little digging for higher probability. Every uptrend that everyone want's to be part of early starts from underneath the green.
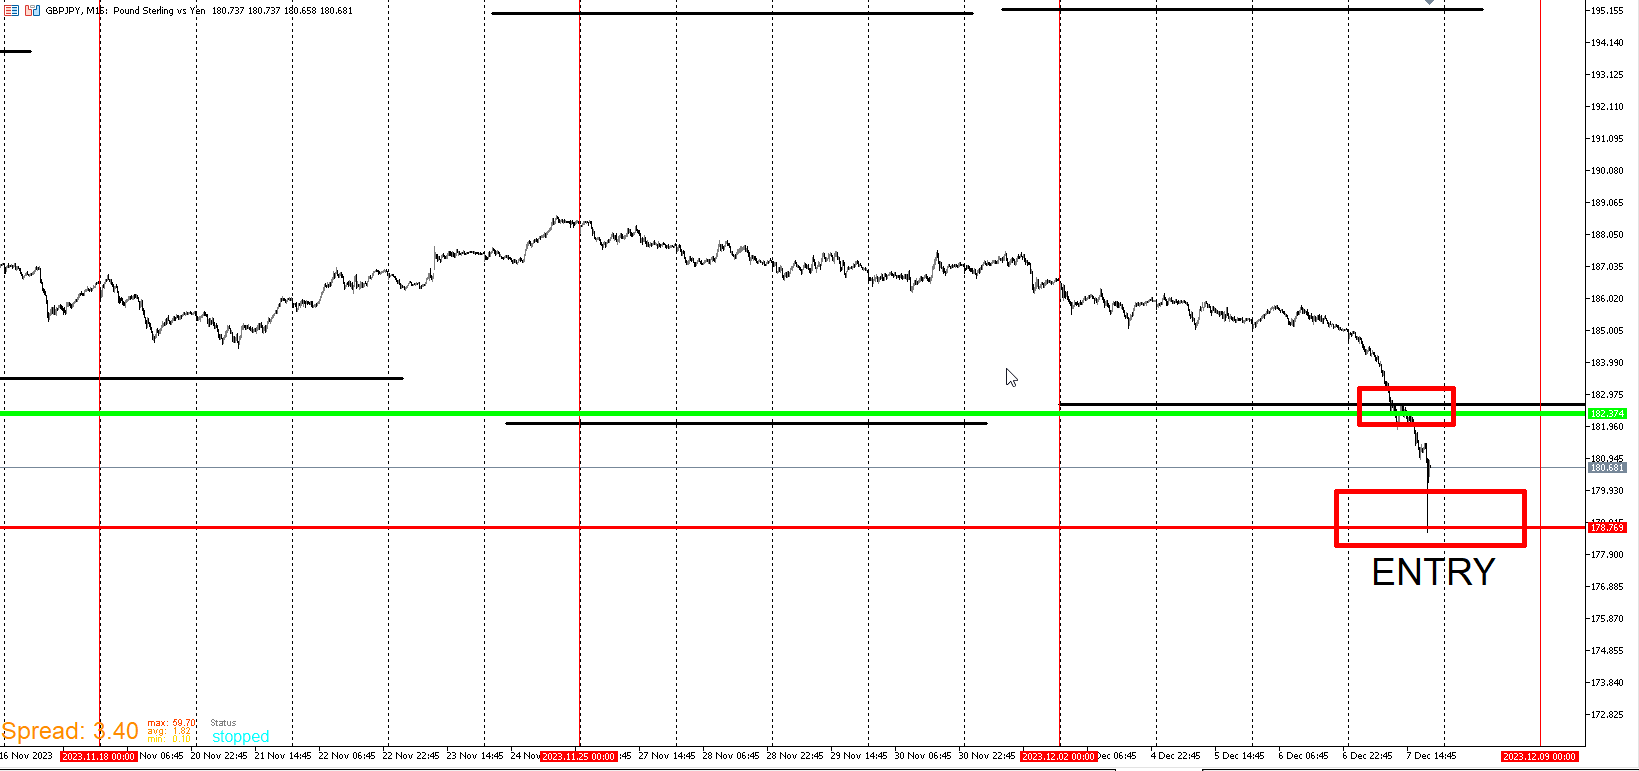
GBP/JPY
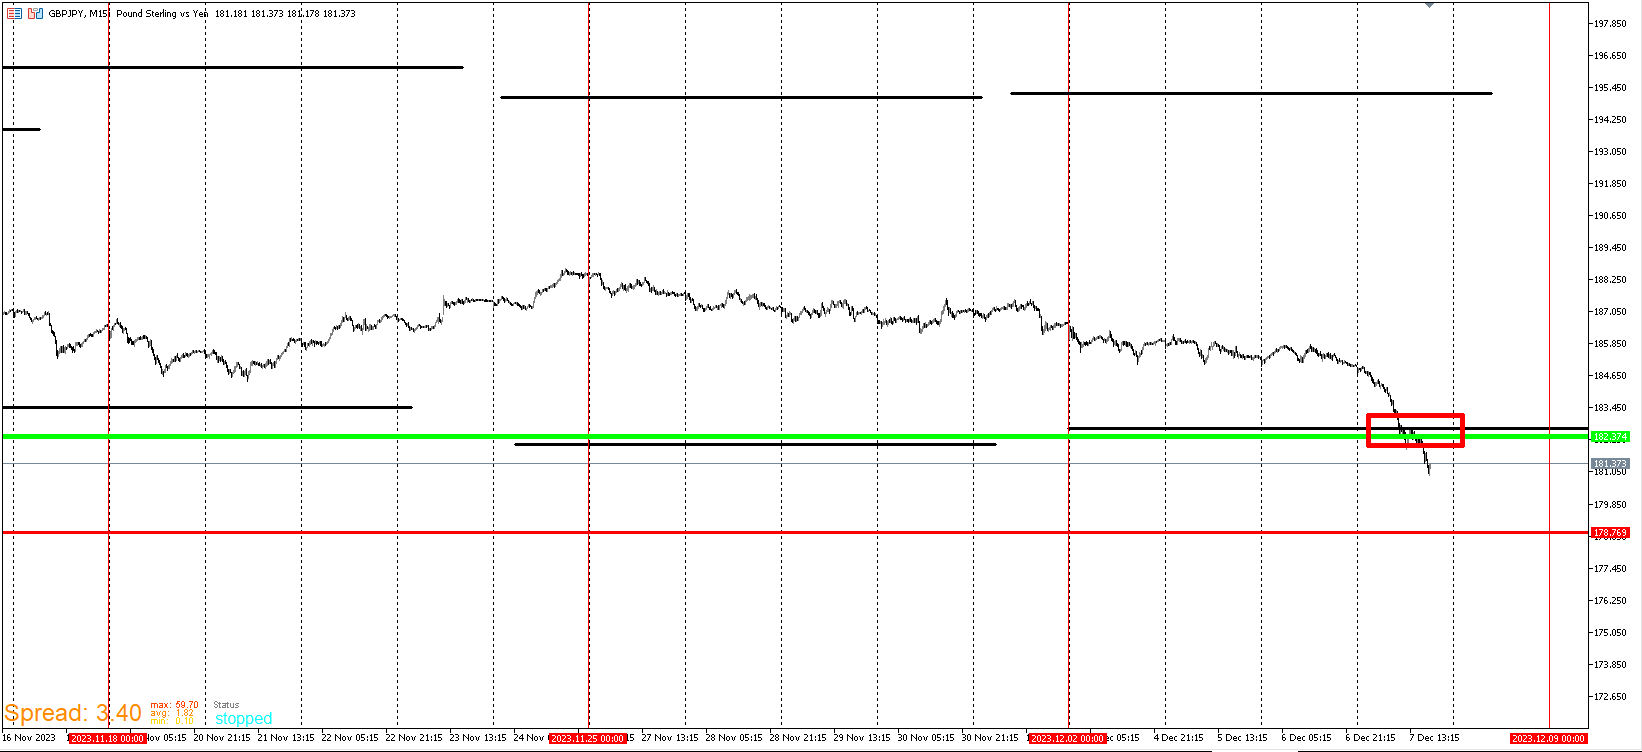
CHF/JPY
The green line is Right on top of the wall line. I'm still looking for price to go lower.
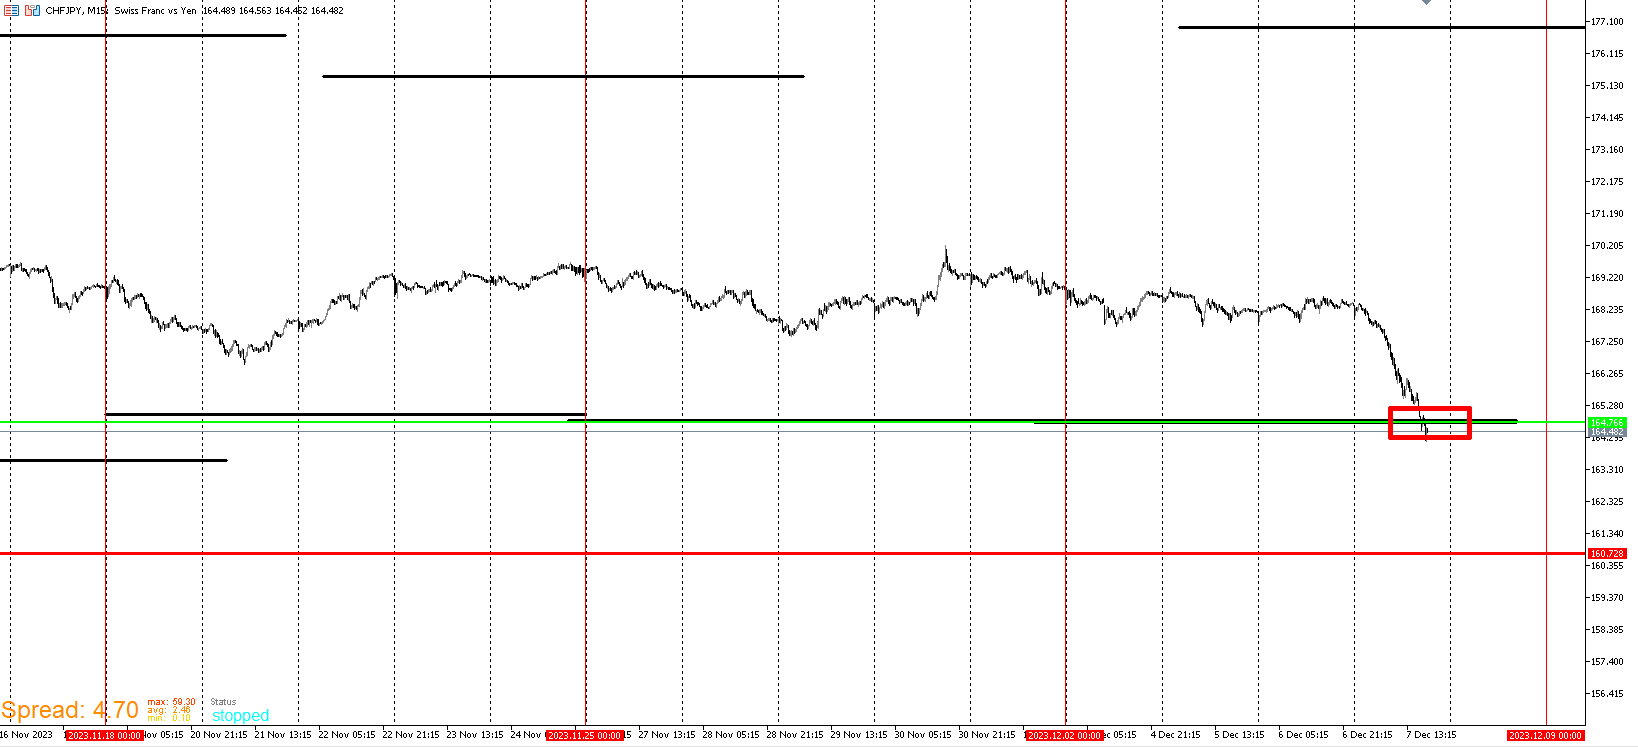
CAD/JPY This one is set up different from the rest. It may get down to the Wall. It may not. I'm still interested as it nears the red line. I just prefer to be under that green line.
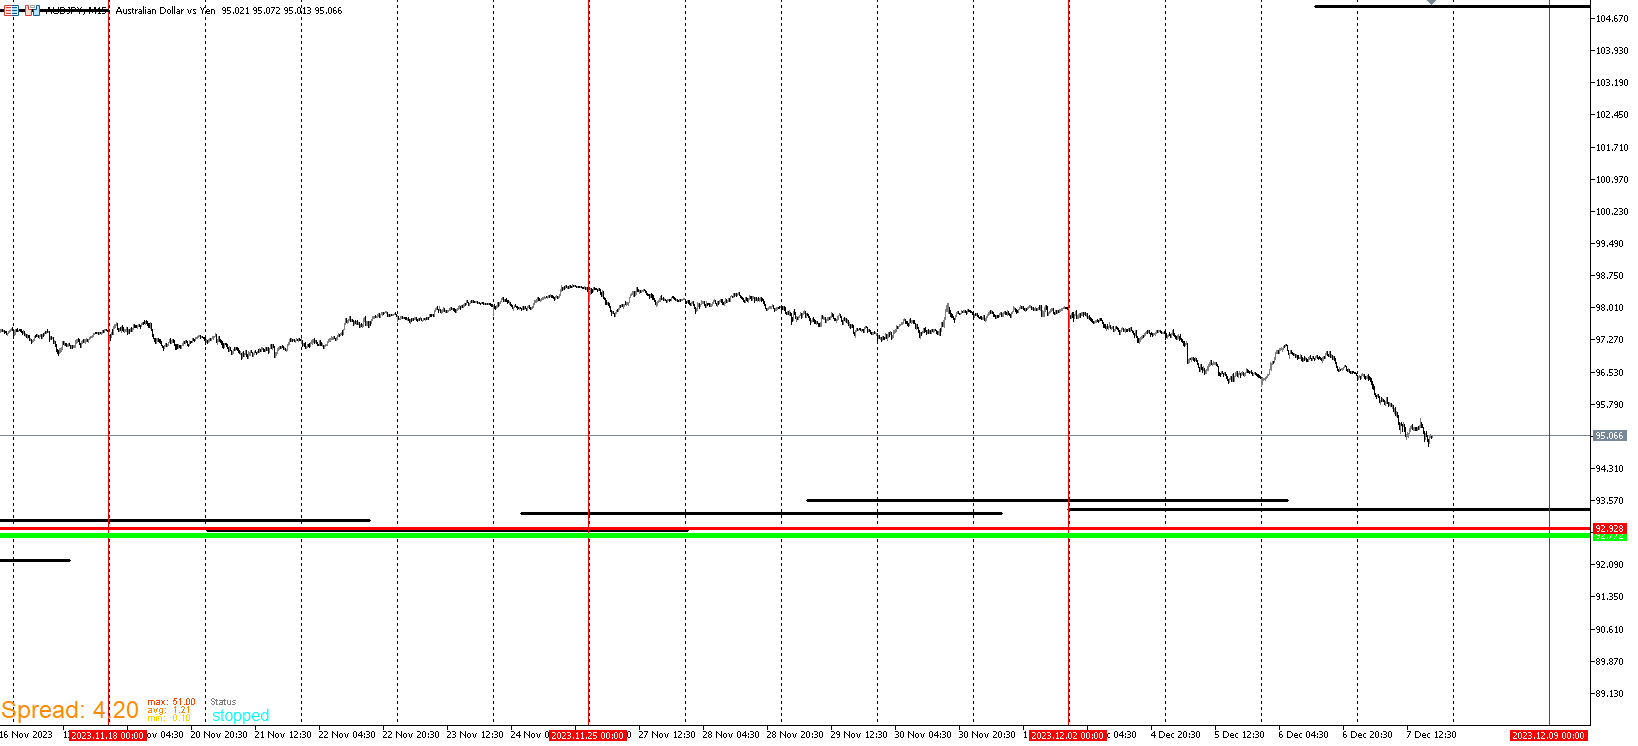
AUD/JPY
-
RE: My EA updateposted in General Discussions
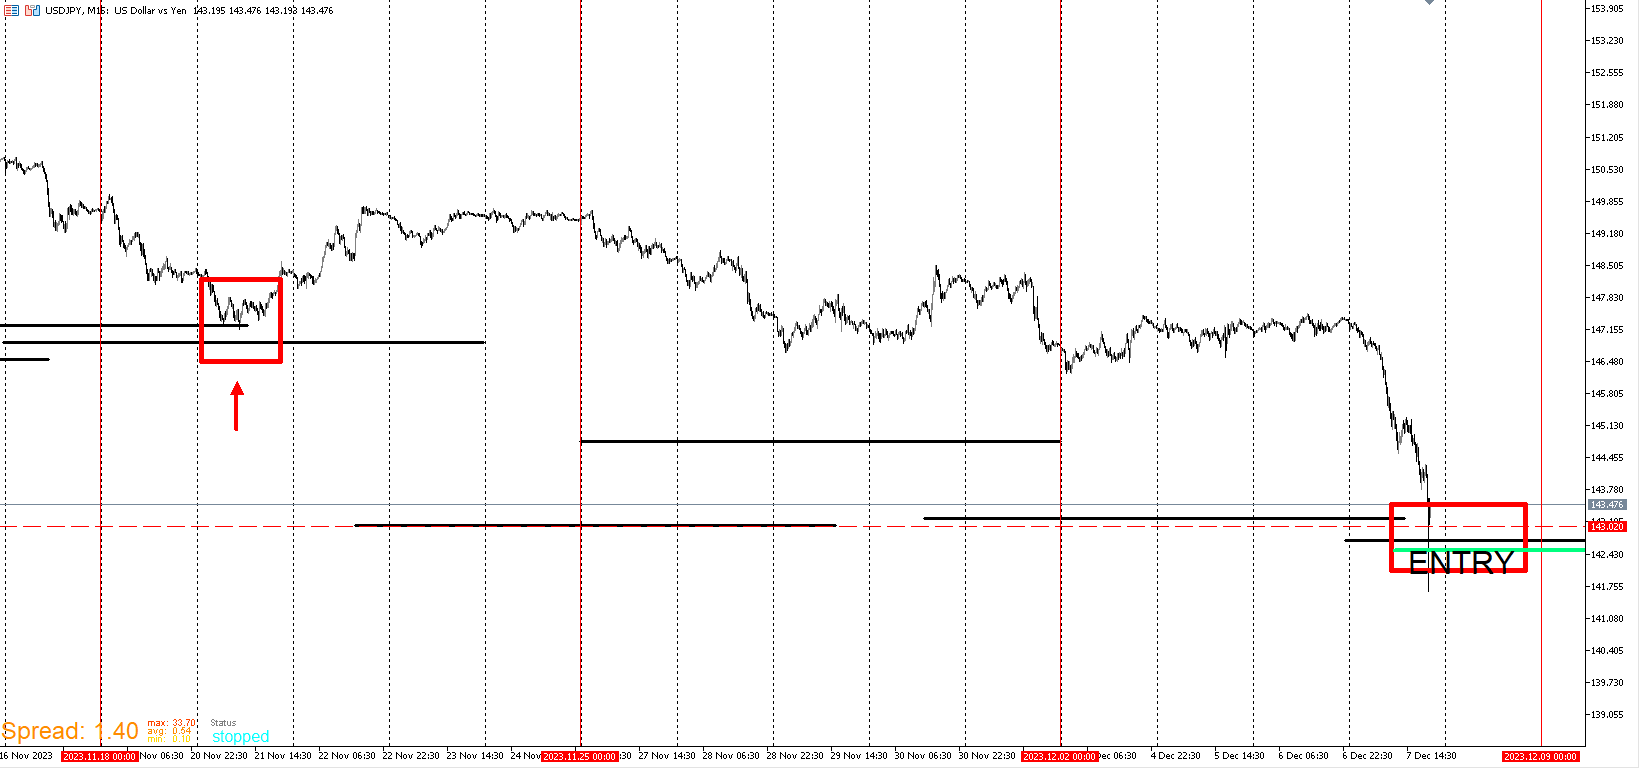
I am posting a live time example of the signal the my templates are currently generating. Here you will see my entry plan based on the Wall Template. There are other templates lining up but I've only gone in depth and provided examples of the Wall Template. I will go further into my other Templates as this start to make more sense. It will be confusing if I binge blast everything with no live example. I want to build up so that other Templates are understood before explaining others.
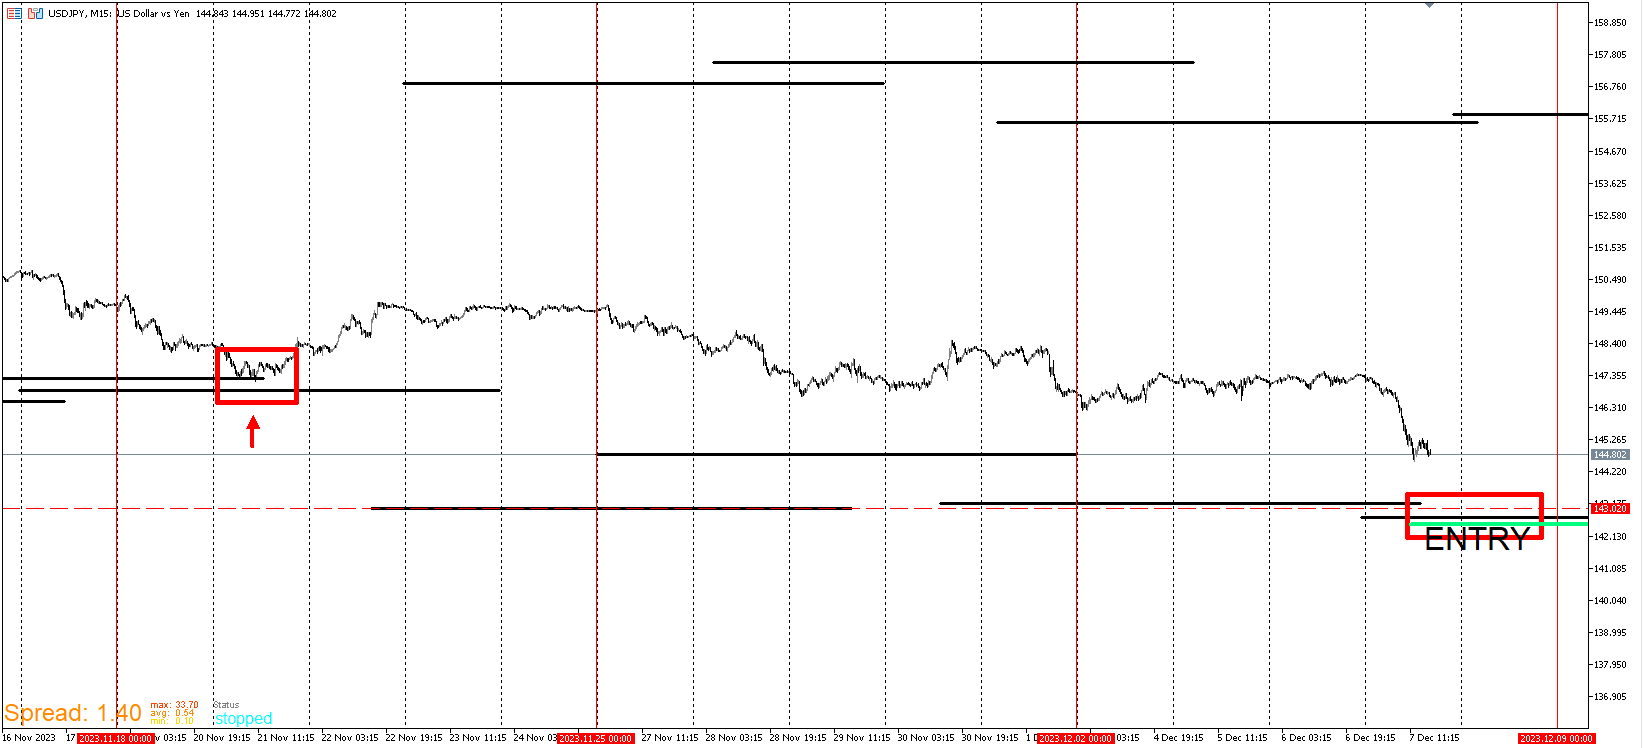
Keep these price levels in mind. Mark them on your chart.
USD/JPY
143.188
142.719I'm long from these ranges and confident to hold for weeks. Please don't take this as advice for you to enter. This could be the rare case price continue to grind down. I am confident here because previously price hit a wall 12 days ago and price is now below it. That's the failure I'm looking for. This is purely for demonstration purposes.
-
RE: My EA updateposted in General Discussions
USD/CAD WALL EXAMPLE
https://vimeo.com/891656583?share=copyI will post more examples of the Wall template. I'm currently waiting on Vimeo to finish optimizing. Sorry for taking a while to update. My work schedule go busy here recently. To give a summary for the Wall Template, It's a template that gets my attention when price nears it and as I said, I use it in conjunction with other templates. Very rarely price violently crashes through but in the event when it does, it's a good sign. My algos are designed in a way that if they fail, it's time to enter. In short there will be opportunities to enter at or near the line but be prepared for price to grind down below. I have filters to avoid getting in too early.
Here's my second favorite template that can help with that. This template doesn't always have to come near template 1. When they do mesh up, it's better. This is Template #3.
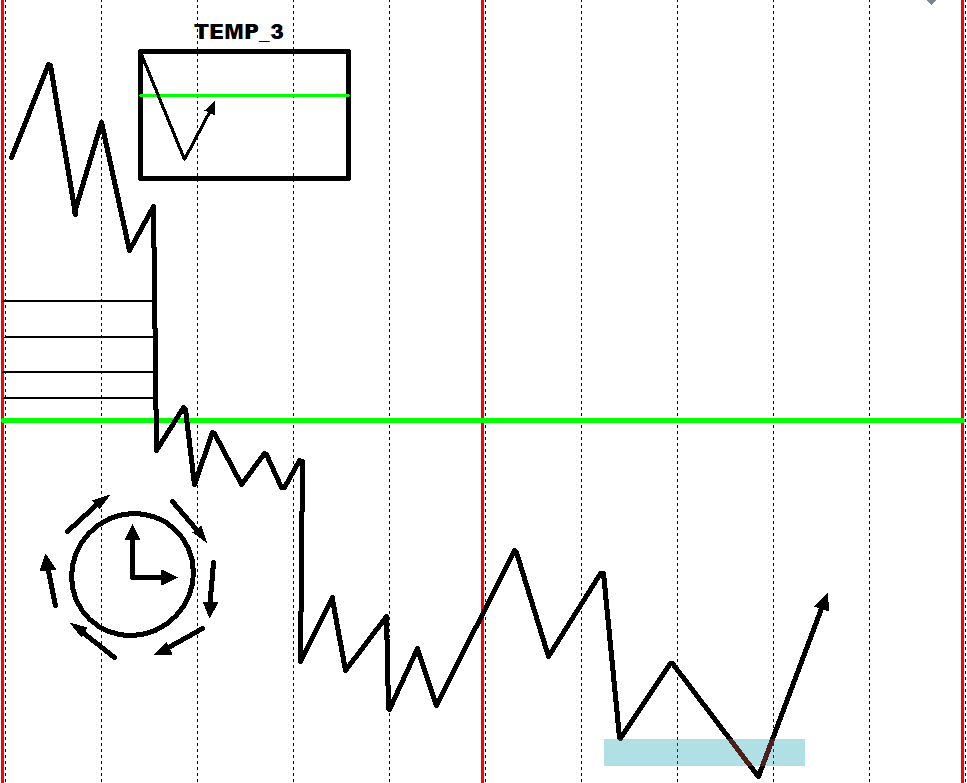
For this template, I only look to get in below the green line. How far below? I prefer some time to go by first . That could be 3 days or a week. Remember, I don't enter at the exact time price hit the level. I need to see some digging and accumulation before price reverse and like the Wall Template, I use this in conjunction with other templates to give me the best entry. There are blue levels above the green. When price comes down to them, they turn black. Price does push up from those levels, but I'm not interested in being part of that ride. I'm only interested below the green. In selling it's the same thing but reversed.
-
RE: My EA updateposted in General Discussions
Here's my first example. It's the GBP/CAD pair this year. This is a video format of metatester. The black lines aren't based on market structure. My advisors as a whole don't look at market structure. So the black lines aren't monthly highs or anything. I have programmed a red box and arrow on the specific day and time to visually see the reversal Just for demonstration purposes. You will notice the second from the last one gets crushed through. I have 2 other templates that invalidated taking that position. When it went lower and pinched down to the lowest black line while my other templates confirmed a high likely reversal. That's when it was time to go long. This is an actual trade that I entered at the bottom with maybe 20 pips of drawdown at the most. It ran 800 plus pips from there. Unfortunately after about 150 pips in profit, My broker did a transition and closed out all my trades.Every trade I had open was a bottom catcher. I'll post it later because I recorded it at the time. I will add this. I don't buy at or near these lines blindly. If my other templates line up I'll buy whether it's near, on, or below. When I see price approaching these lines, it puts me on notice.
https://clipchamp.com/watch/kx0AUo0Qq8j
Here is the GBP/JPY PAIR for this year.
https://clipchamp.com/watch/ZKfODdbHFZX -
RE: My EA updateposted in General Discussions
Here is my favorite template. Template 1 which is referred to as the wall. Usually when price reaches this level, other favorable template conditions are met. This is an opportunity that happens at least once or twice a year for every pair. The opportunities are either shortly before the line or below to go long. I use this in conjunction with other templates that I will dive into later. There are other lines on the chart but this one is the only one I look out for. So I don't use this Template live. I run the backtest and get the price levels of the current and most recent black lines.
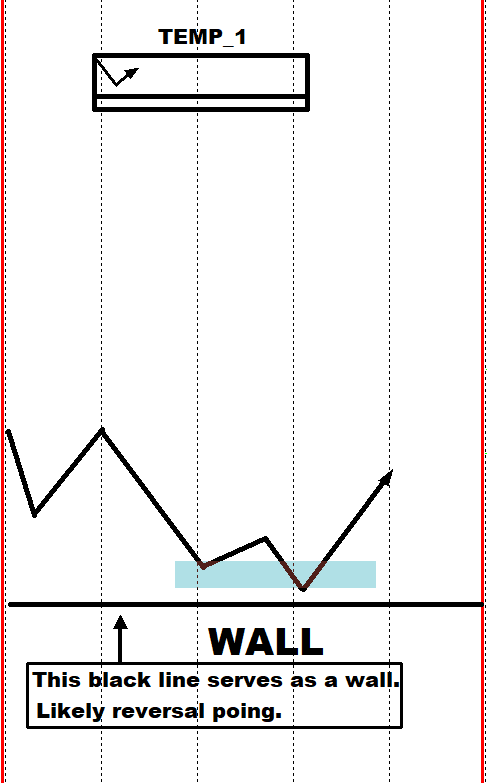
I will post examples of this. Ignore the typo in the graphic. I meant point. The reversal point isn't always an exact point. This is moreso a zone and price could go below. I anticipate the start of an upward trend when price gets into this zone.Vice Versa for selling short.
-
RE: My EA updateposted in General Discussions
I will simplify this the best I can. This strategy is an amalgamation of strategies that outputs templates. These templates represent when the time is coming to enter trades that are likely to reverse and run. The way these templates are generated is through backtesting and setting the dates to specified times. The dates vary depending on which template EA is backtested. When the backtesting is done, the template generated is then saved and updated to a live chart. From there the EA that was used to backtest is then inserted to update the chart. So now the EA runs on the live chart just as it did on the backtest.

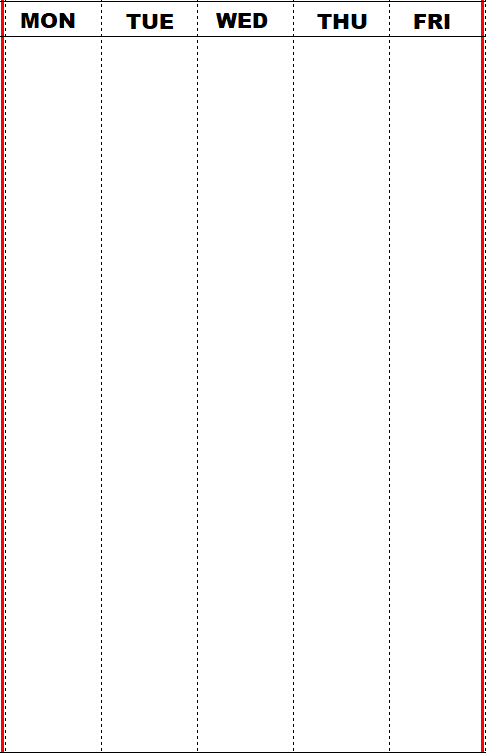
Here's the chart template. It's just a basic white background template with red vertical lines for the start of the week and the end of the week. This template is used in the rest of the templates. I'm not interested in just looking at weekly candles highs and lows. I'm interested in how 15 minute candles move in weekly candles in correlation with the templates. So there is still a larger timeframe analysis. Just not in the way most traders approach it.
-
My EA updateposted in General Discussions
Hi and thanks for viewing this thread. Here I will post a series of explanations and examples to what I've come up with after a year of focused work here on FxDreema. I will not uncover exactly what's going on under the hood. I'm just sharing my thought process and results. I'm curious to what other creators are coming up with and if it's paying off. Here's my Thread for what I came up with so far.
First and foremost I will explain my overall style. I built this system for swing/positional trading. It's not meant for everyday trading. I will say this. The signals are based on intraday strategies but I'm only interested when those strategies fail which will be presented. So what these EA's do is provide templates of high probability setups that offers substantial rewards with little risk in comparison. There's still needs to be discretion but these templates can aid in decision making.
-
RE: session tradingposted in General Discussions
Very easy to set up but I promise you that it's not a profitable strategy.
-
RE: MY SLOW BACKTEST PROBLEM SOLVED.posted in General Discussions
@jstap I'll look into that. I always make sure they are numbered correctly. I missed them in the example. I remember using the normalize function and the numbers were still off. Unless I'm missing something, the modify color does work the way it is. It changed from red to light coral so it's barely noticeable. I'll take your advice and give it a shot. Thanks.
-
MY SLOW BACKTEST PROBLEM SOLVED.posted in General Discussions
I wasn't sure where to put this. It's more of an observation than a tutorial. I'm sure that other people are having problems with the speed of their backtesting or lack of. I've been working on a handful of projects for quite some time, and the backtester always become an issue. Once I made a couple of tweaks, there was a substantial difference and I thought that I should share it so that others don't make the same mistake. I'm uploading the project with both the slow version and the fast one. I use the 1 minute OHLC but it still holds up on real ticks. 15 minute timeframe.To test it out, download it twice with the opposite version deactivated. You will see the difference. If you're a guru who reads this and see something wrong or something that I should have known, bear with me. I'm only working with 10 percent knowledge of this program with no coding experience and there isn't much information out there on it other than bs hedging strategies on youtube.With that being said, I love the program and think it's superior than any other I've come across. There are a million ways to skin a cat with it and it satisfies my need to problem solve. I've seen a few concerns about the backtesting speed. Some reasons state that it's too many objects, some say it's blocks, some say it's mt5, some say it could be computer hardware related. While all of them can be true, in this situation provided, it's blocks. I thought it was all the other things but once I changed the blocks, it sped up a lot. The project provided isn't a specific strategy. It's just a random line drawn out at a specified time. The goal is to show that the weekday filter and misuse of chart blocks really bogged the tester down.
-
RE: How to scan previous day for engulfing barsposted in Questions & Answers
@cyberspace If you are still having issues, can you share the updated project?
-
RE: Trendline move forward in time.posted in Questions & Answers
@tec-nacks Sure no problem. I created a simple setup to get the basics across. I'm trying to blend it with other setups but there are some issues I'm trying to work out. I'm sure that I'll figure something out and this is definitely the baseline I've been working hard to figure out and couldn't find any threads on it.
-
RE: Trendline move forward in time.posted in Questions & Answers
I finally figured it out. The answer was right in my face the entire time. I needed the object loop blocks. FOR EACH OBJECT--> MOVE-->SET TIME 2 TO NOW.
-
RE: Trendline move forward in time.posted in Questions & Answers
@sktsec It's not an indicator. I've been strictly doing EA's maybe that's the issue and I will look into indicator creation. The line is an object and it does repaint.
-
Trendline move forward in time.posted in Questions & Answers
I've been using this platform for a year now and I'm grateful for the contributions people make on here. Sometimes I get stumped and come to here to find the answer. When I can't find the answer, I tinker with it long enough and eventually figure it out. For this issue, I couldn't find the answer anywhere and I've been messing around with it too long. What do I need to do in order for time 2 of the trendline to continue over the course of days as price updates? It works in a single day but I need that line to update everyday instead of that single day being the cutoff.The idea is that when price reaches that line, that's where the line stop. Here is a picture. The red is what I'm trying to achieve. Thanks.