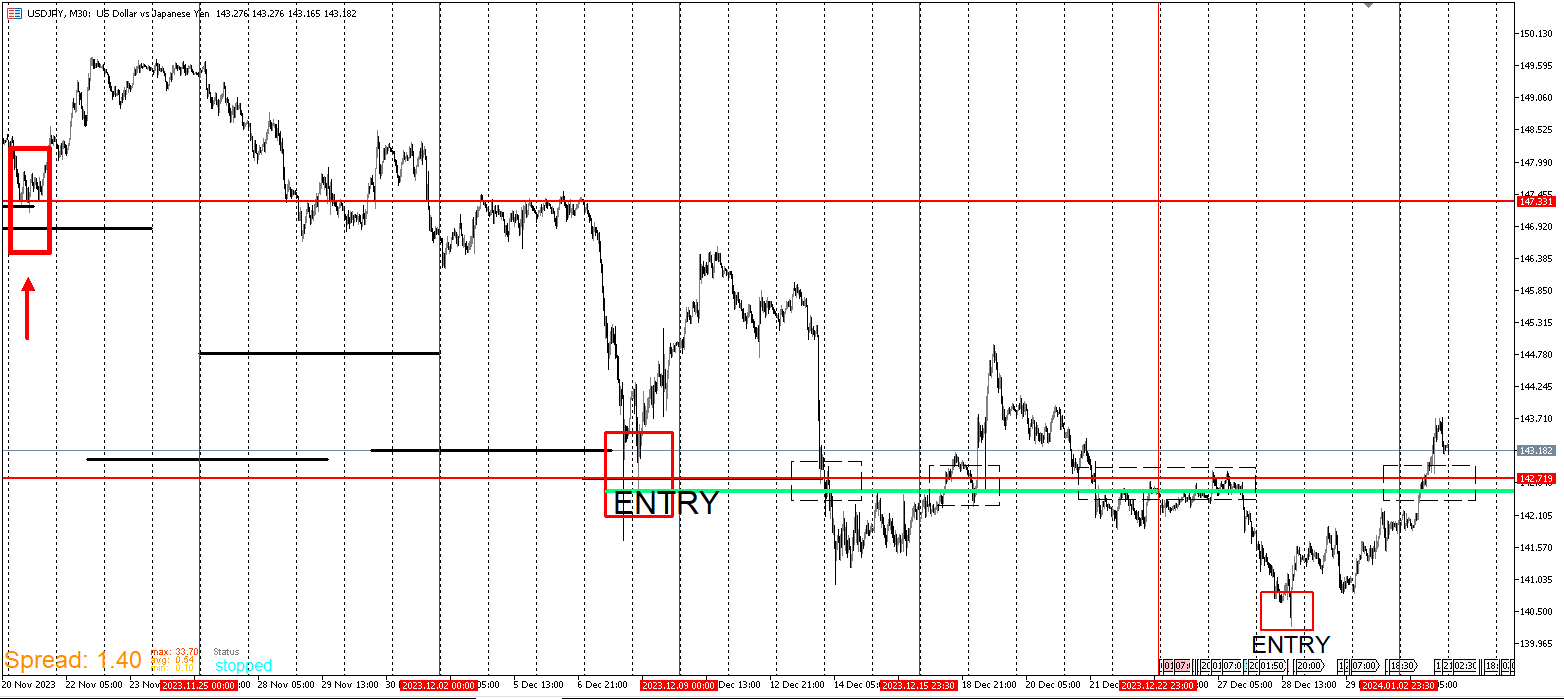
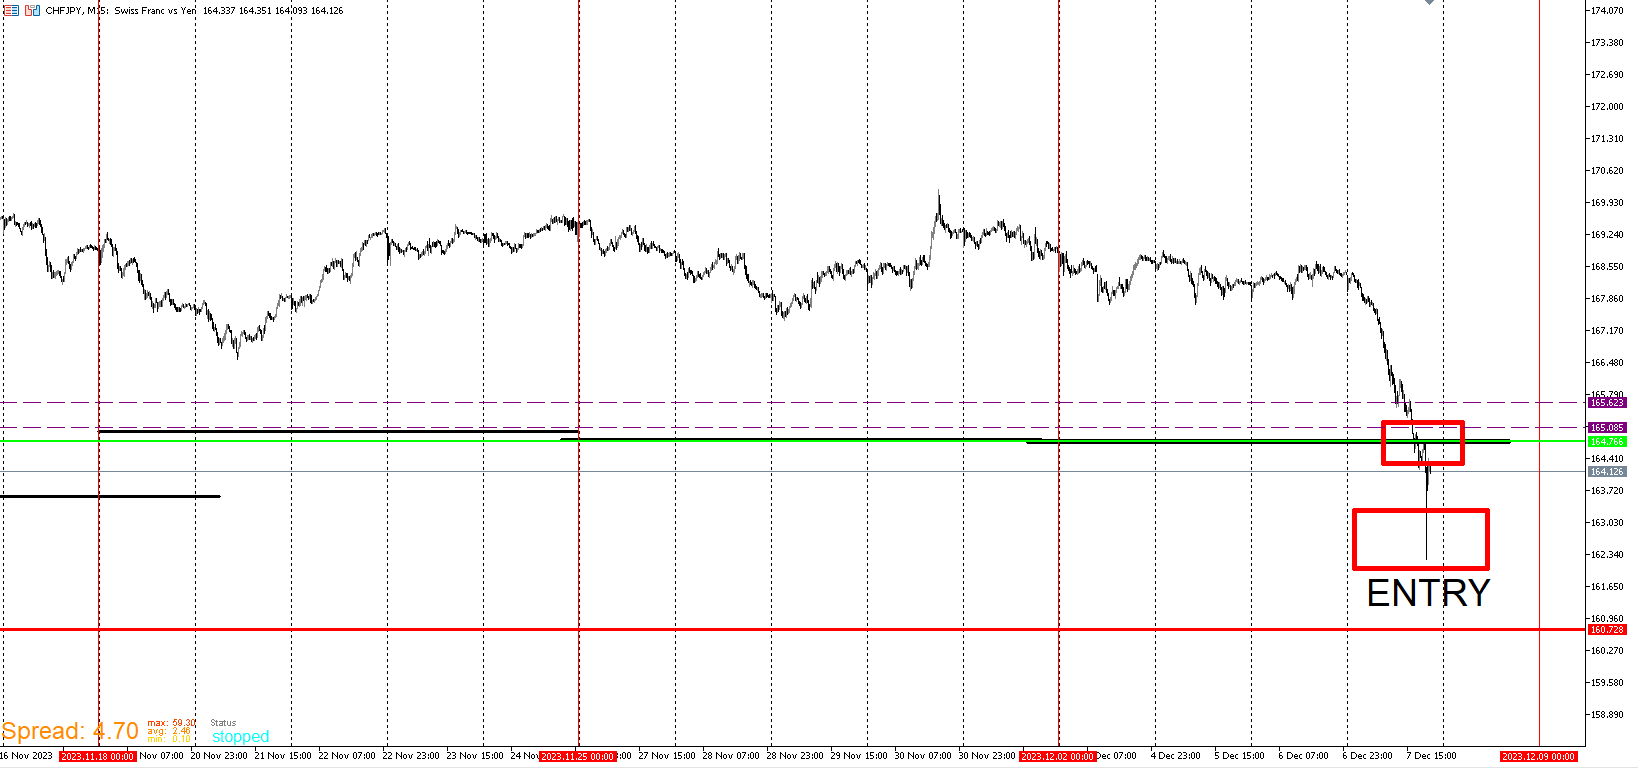
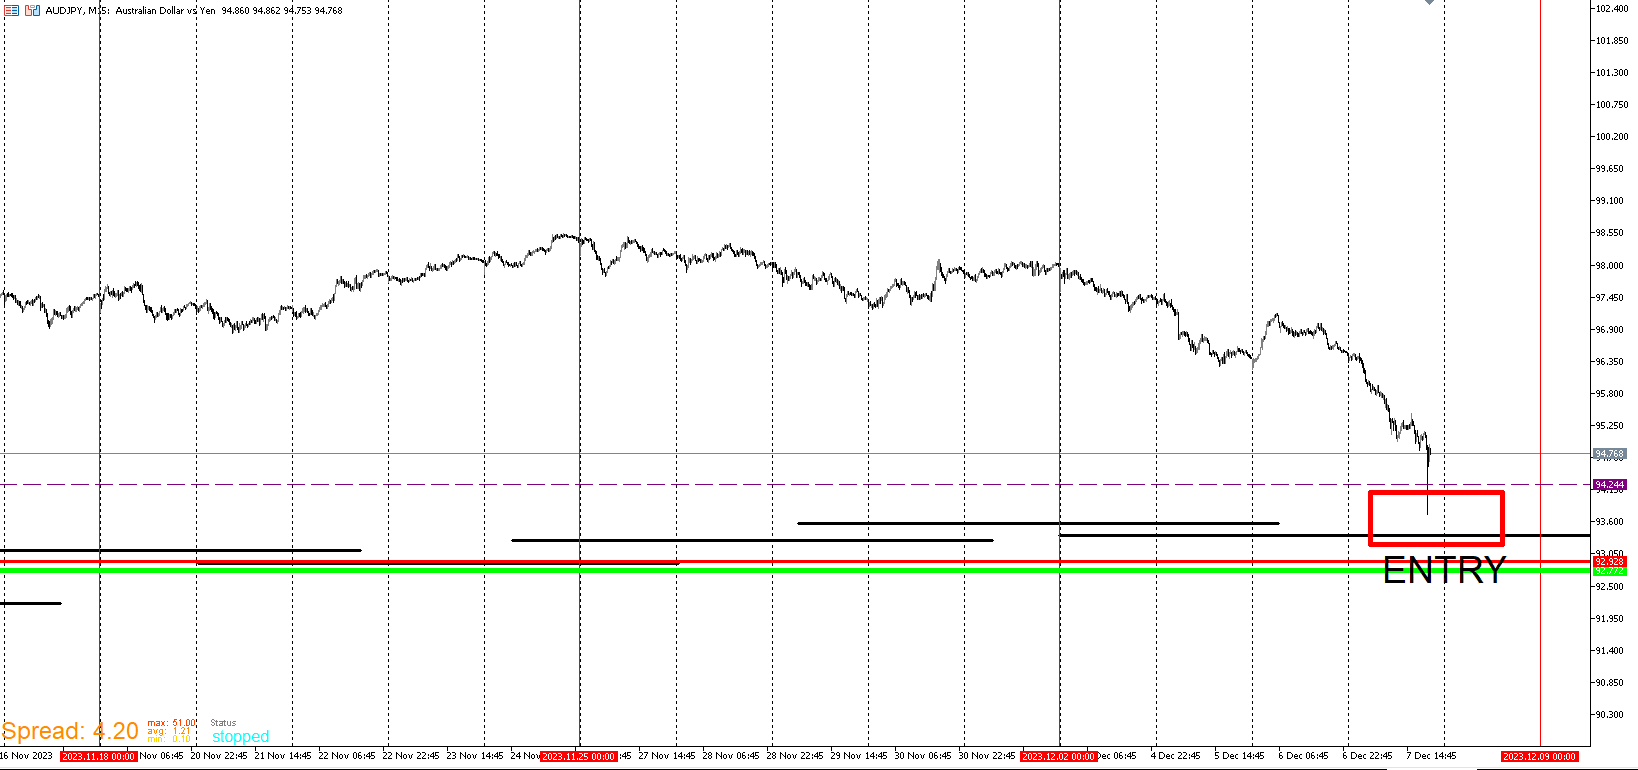
Here is an update on the first example USD/JPY. If you go back to the first page, you will see that I posted the entries beforehand. I am no longer in need of the wall Template. It has done it's job. The upside that I noticed with this strategy is that if timed right, there is plenty of time to access and get out if I choose too. Statistically even if lets say that price does decide to go down further, It more times than not comes back up enough to give a chance to get out with some profit. This is just what I observed through a lot of backtesting and it's playing out here at least with this pair. There is what I consider a high probable entry after it played out but I did enter there and will post the template that given me that signal as well as the trade itself.
Here's what I look for in these setups from start to end.
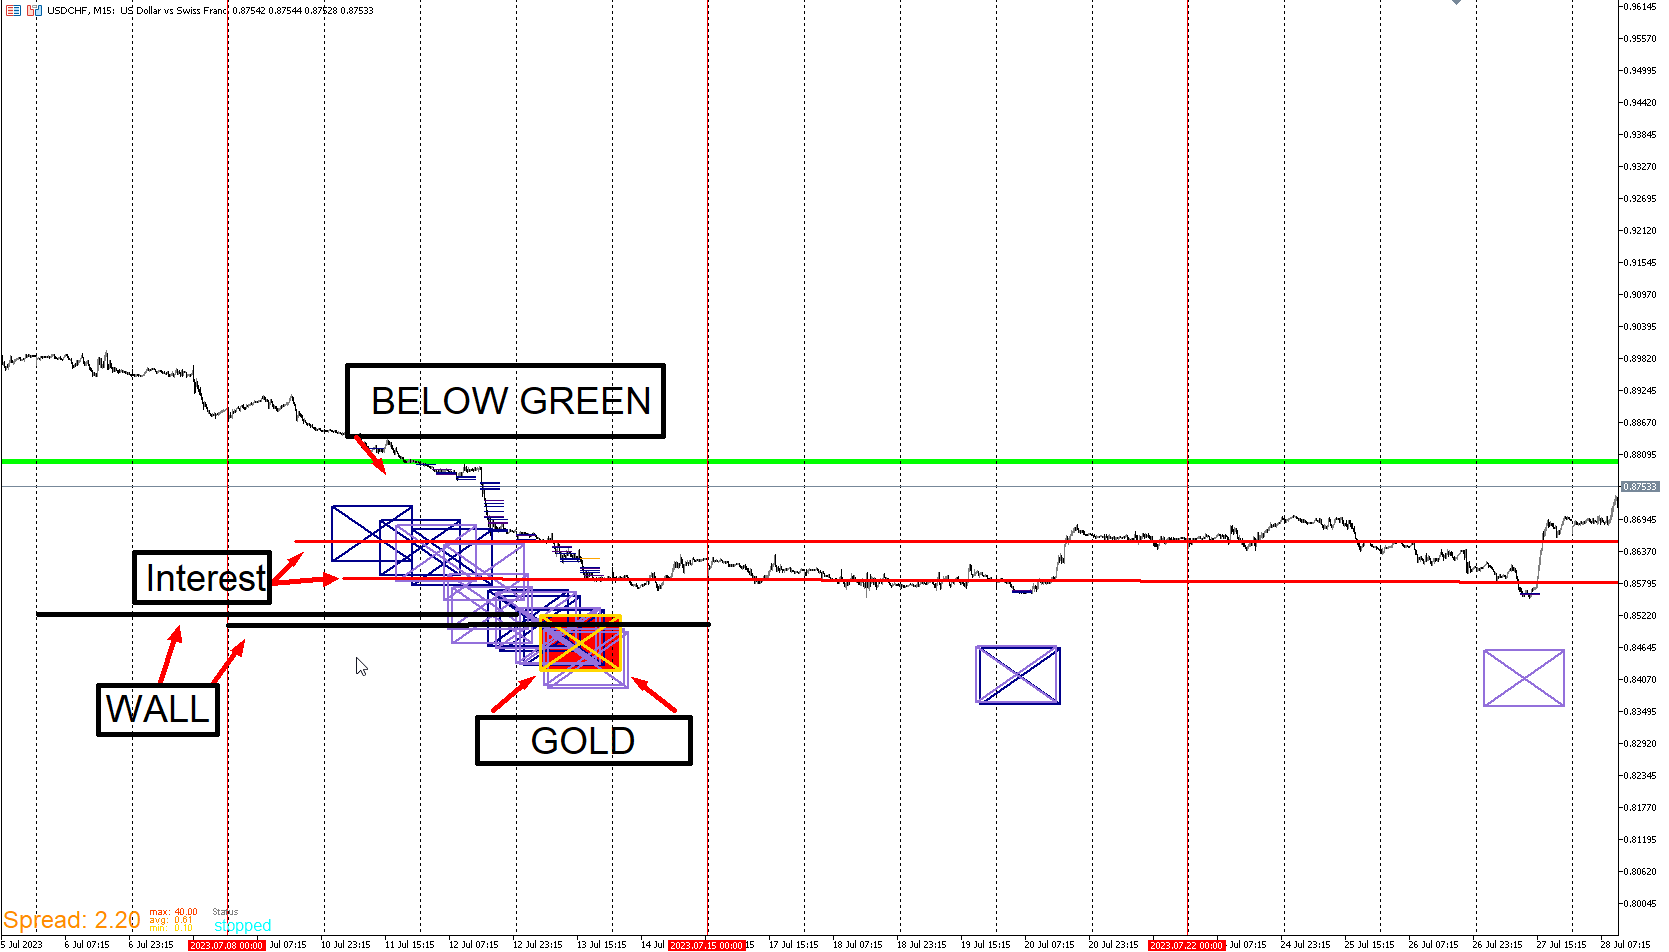
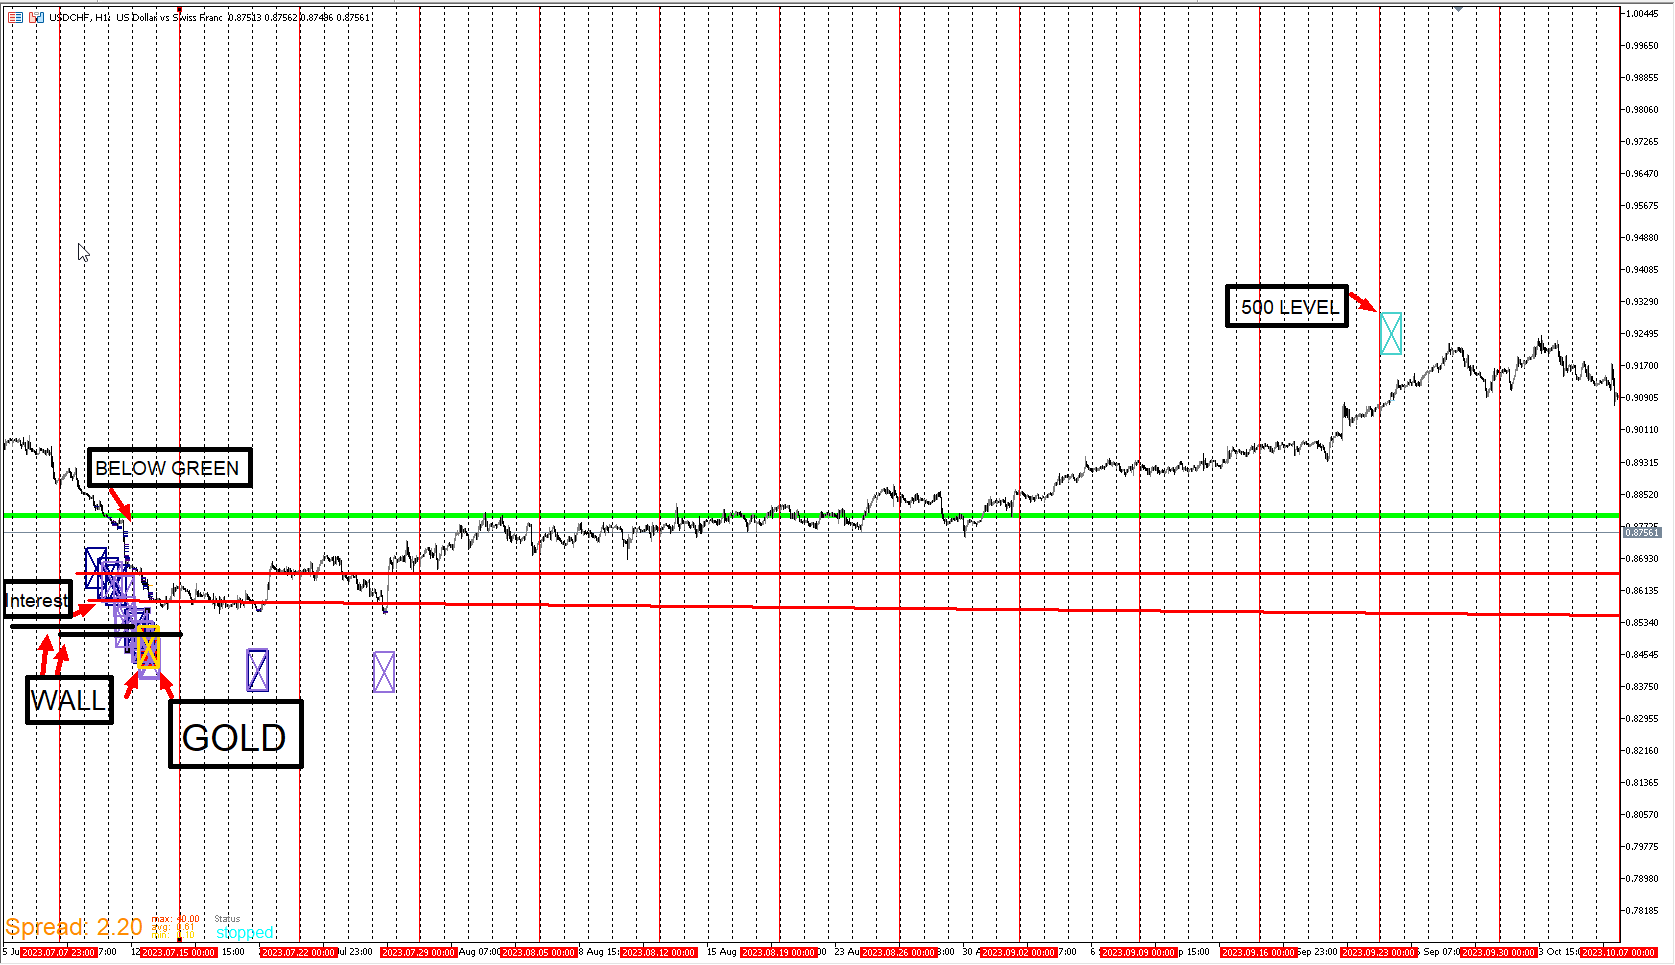
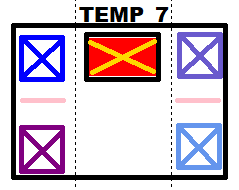
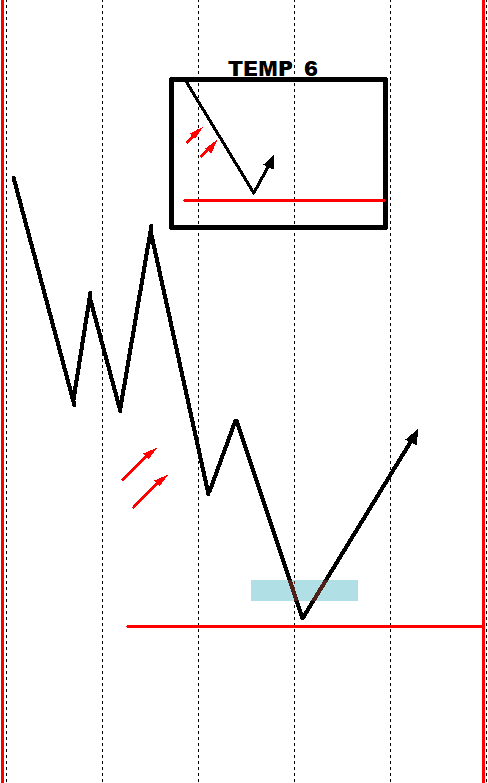
When the Wall and other templates line up, I expect immediate to mid term upside. Sometimes price never returns, sometimes it comes back down. Usually there is 150- 250 pip upside before it comes back down.
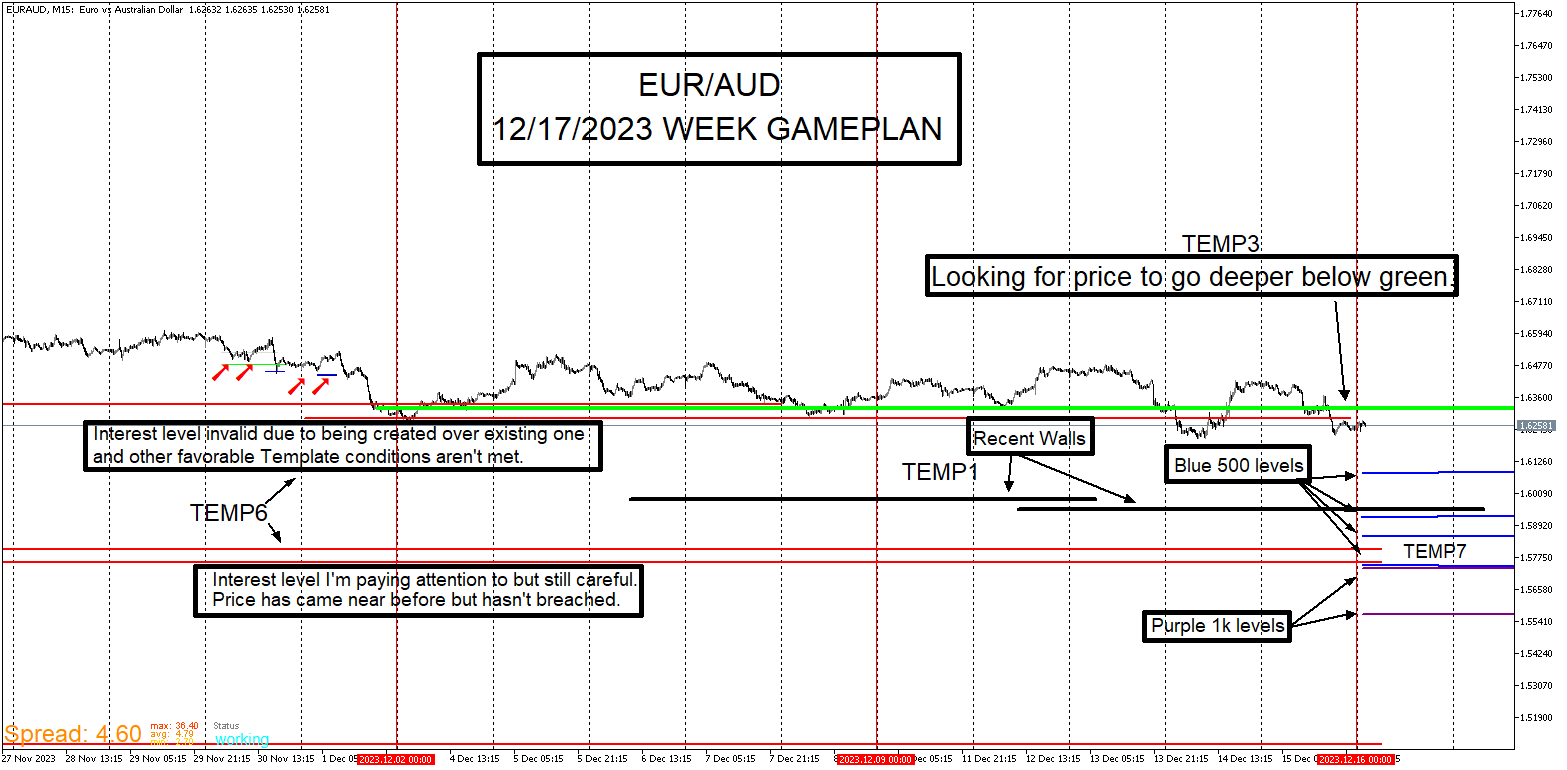
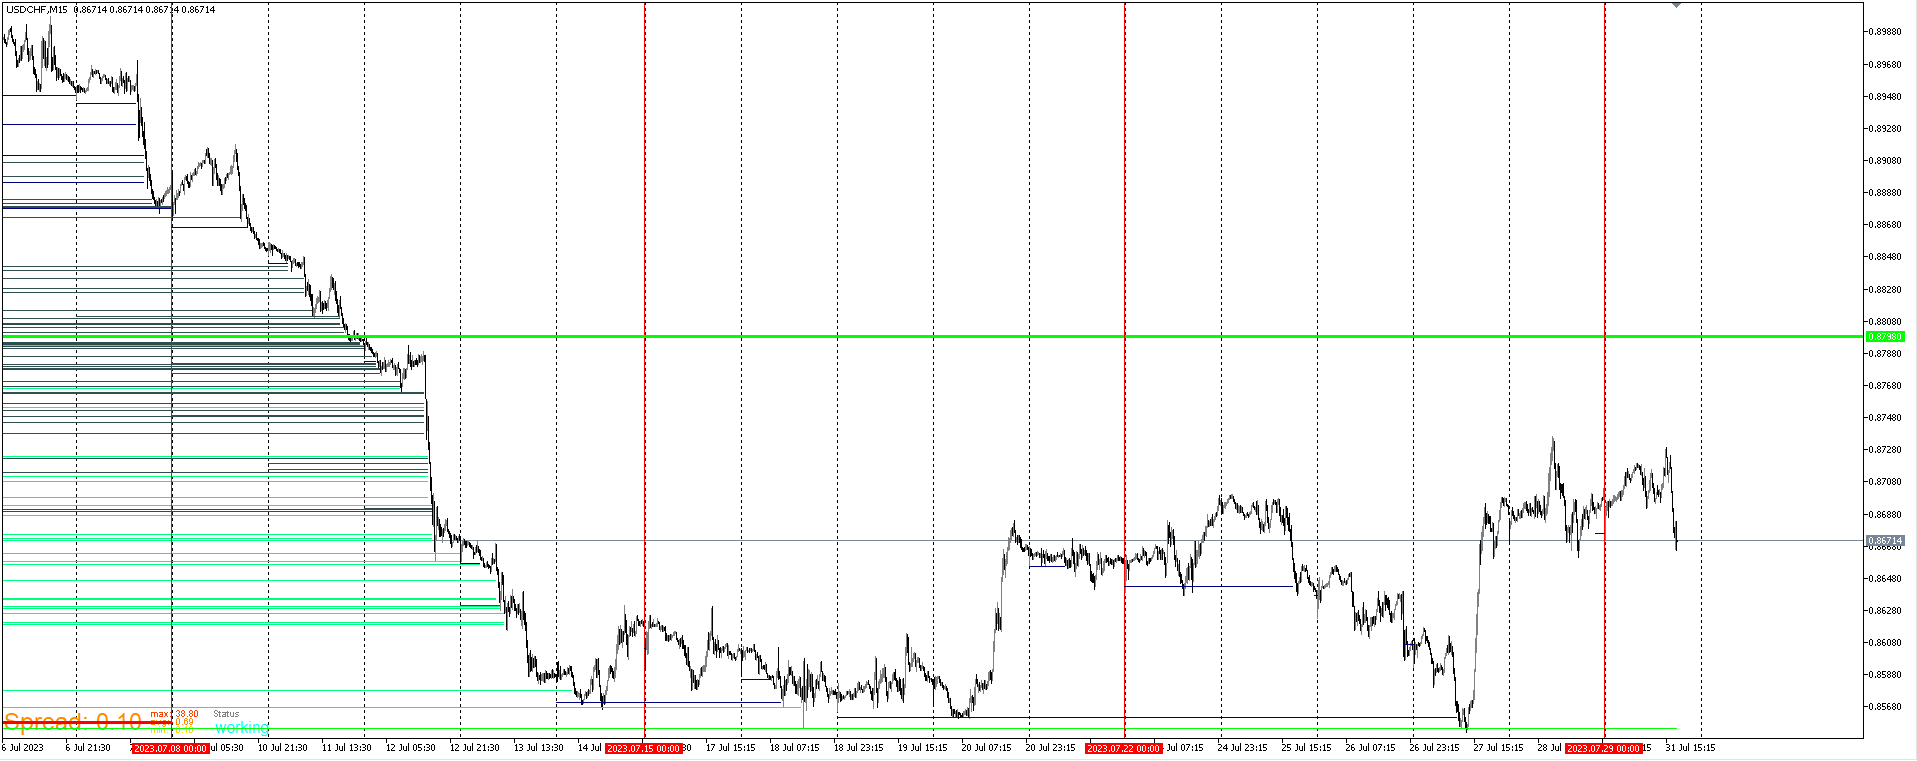
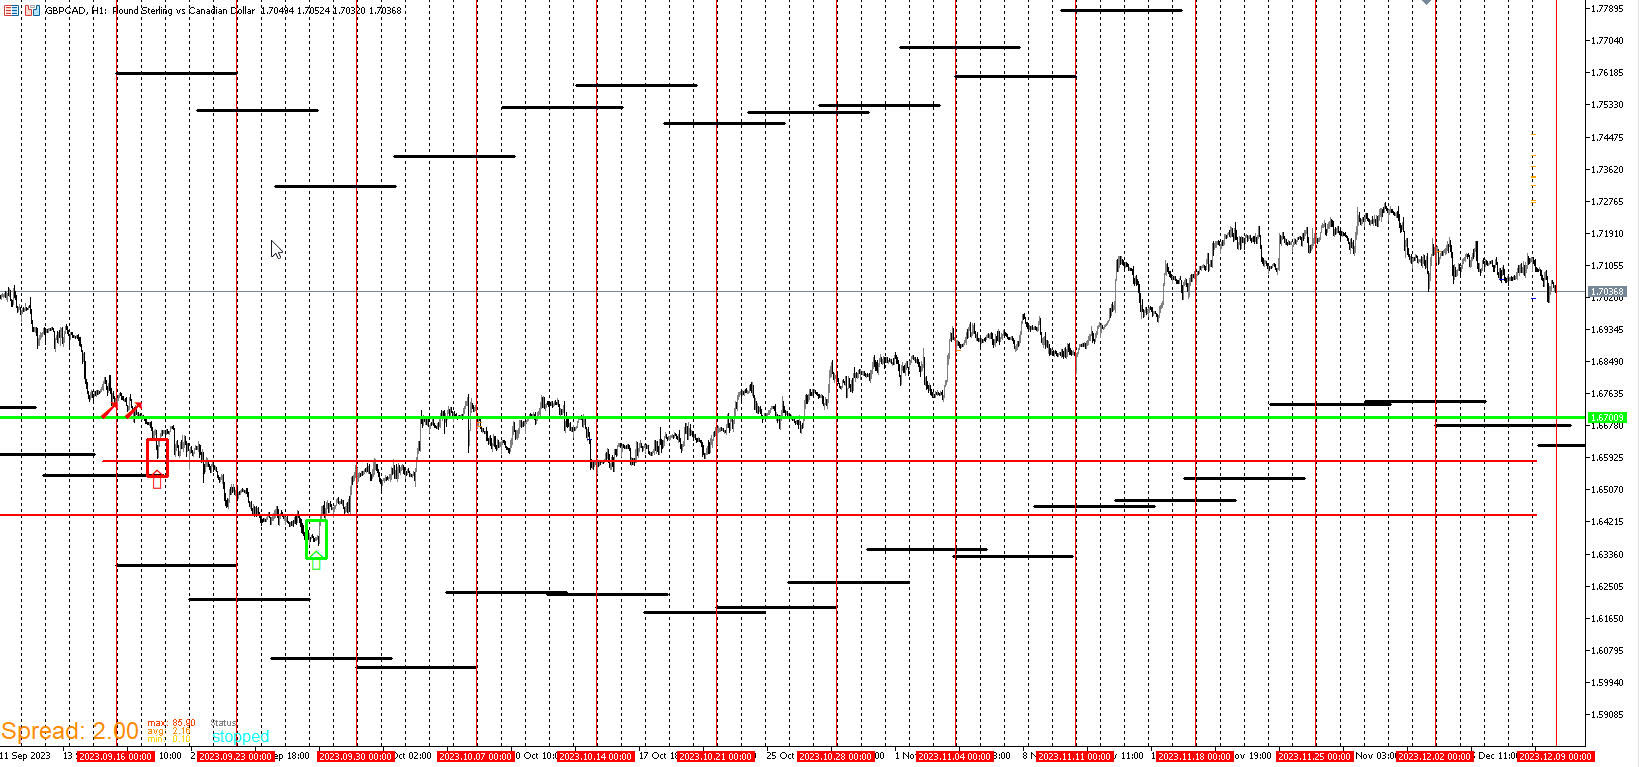
I look for how price interacts with the green line level and interest level when price retraces back to it. I've drawn dashed rectangle boxes around it.
From there it's just letting the trade mature and watch for it to hit the higher levels.