fxDreema

    • Register
    • Login
    • Search
    • Back to the main page
    • Categories
    • Recent
    • Tags
    • Popular
    • Search
    1. Home
    2. JayPhillbrooks
    3. Posts
    J
    • Profile
    • Following 1
    • Followers 3
    • Topics 3
    • Posts 199
    • Best 22
    • Controversial 0
    • Groups 0

    Posts made by JayPhillbrooks

    • RE: My EA update

      I believe that I'm spotting a potential sell for AUD/NZD using the BCC Template sell version. If price reach my defined entry level, This is where I will sell CHF/JPY and possibly the other yes pairs. Conversely I'll go long the CHF pairs which my bias for them were long anyway even though I was too early a few days ago. This is a live experimental entry based on patterns I observed while utilizing the BCC template. As far as my position size, I'm not going full volume. I'm starting with very small filler positions and adding as I get more confirmations. That way when I am wrong or too early, I'm not going into deep drawdown.

      AUDNZD_BCC_SELL.png

      posted in General Discussions
      J
      JayPhillbrooks
    • RE: My EA update

      CHF/JPY seem to be squeezing up so I cut my positions for a small loss. I was looking for a subtle rollover and it's still possible but right now it's possible that price may spike up and if it does, I'm looking to re-enter at or past the walls. I like to see price push to 2 lines because it offers more likelihood for a reversal. If price pushes up to these levels really soon as in a session/day, I'm automatically selling from these levels.

      CHFJPY_WALL (2).png

      posted in General Discussions
      J
      JayPhillbrooks
    • RE: My EA update

      Will go into detail later.

      CHFJPY_ENTRY.png

      BCC_EXE (2).png

      EURCHF_BCC (2).png

      CADCHF_BCC (2).png

      USDCHF_BCC (2).png

      NZDCHF_BCC.png

      posted in General Discussions
      J
      JayPhillbrooks
    • RE: My EA update

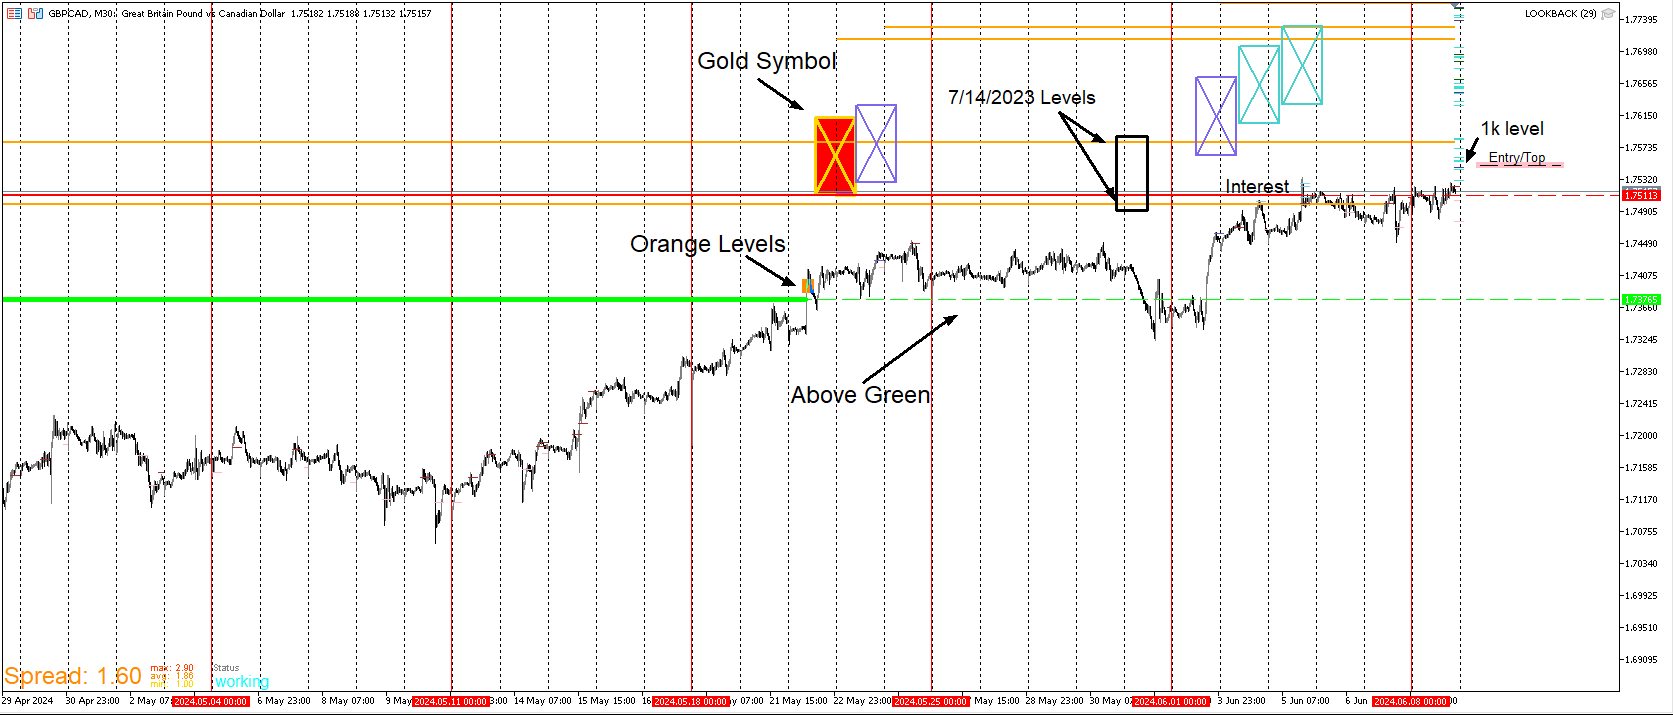
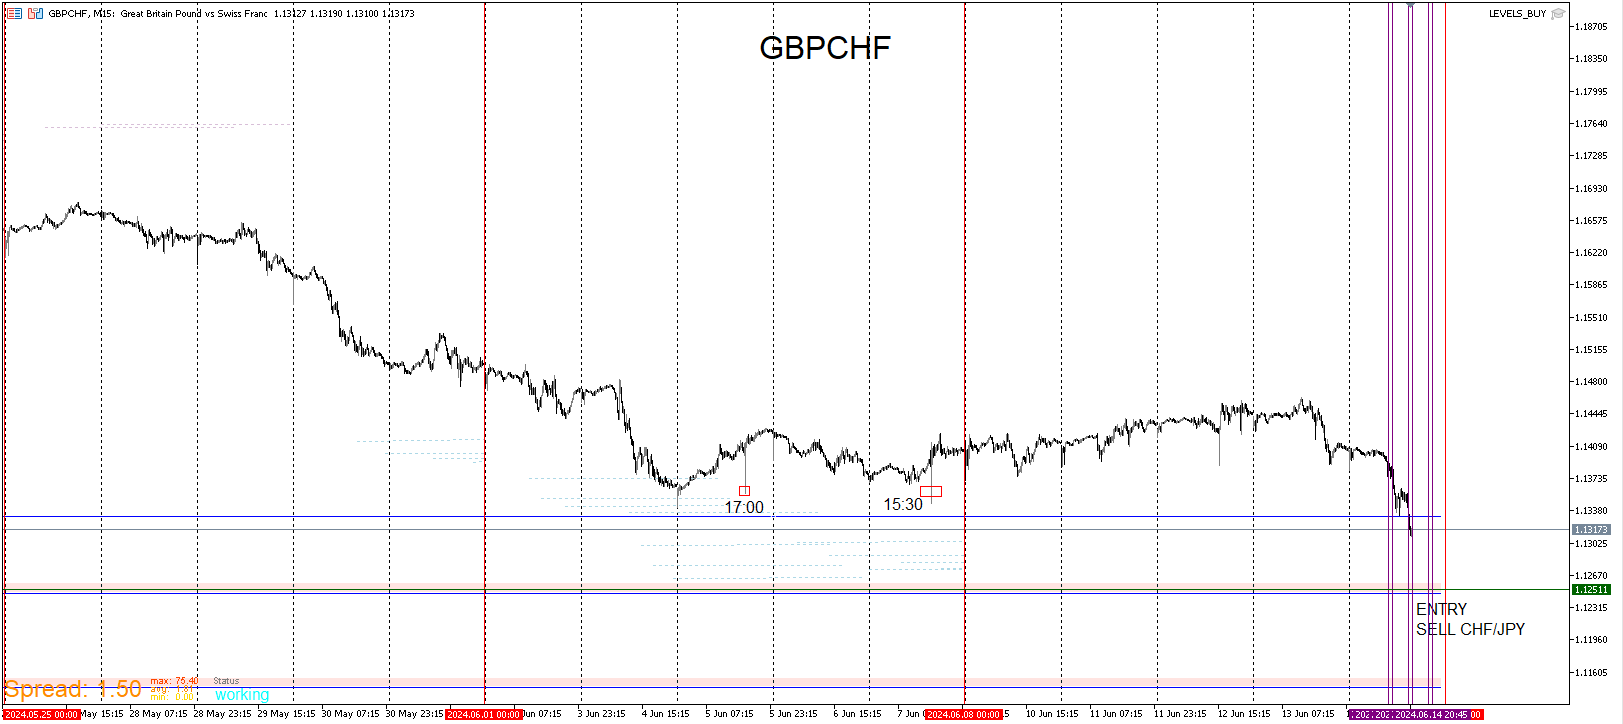
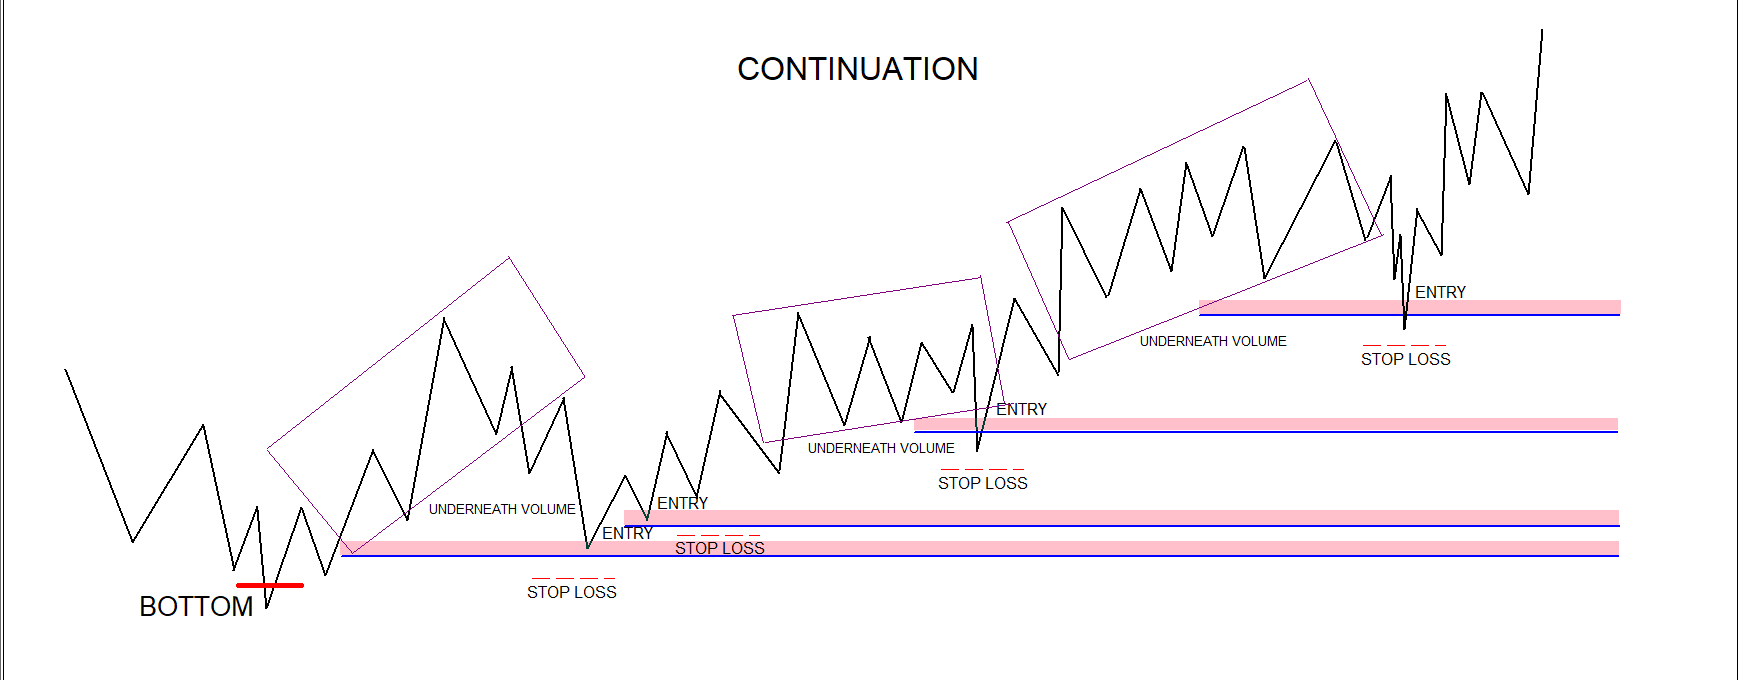
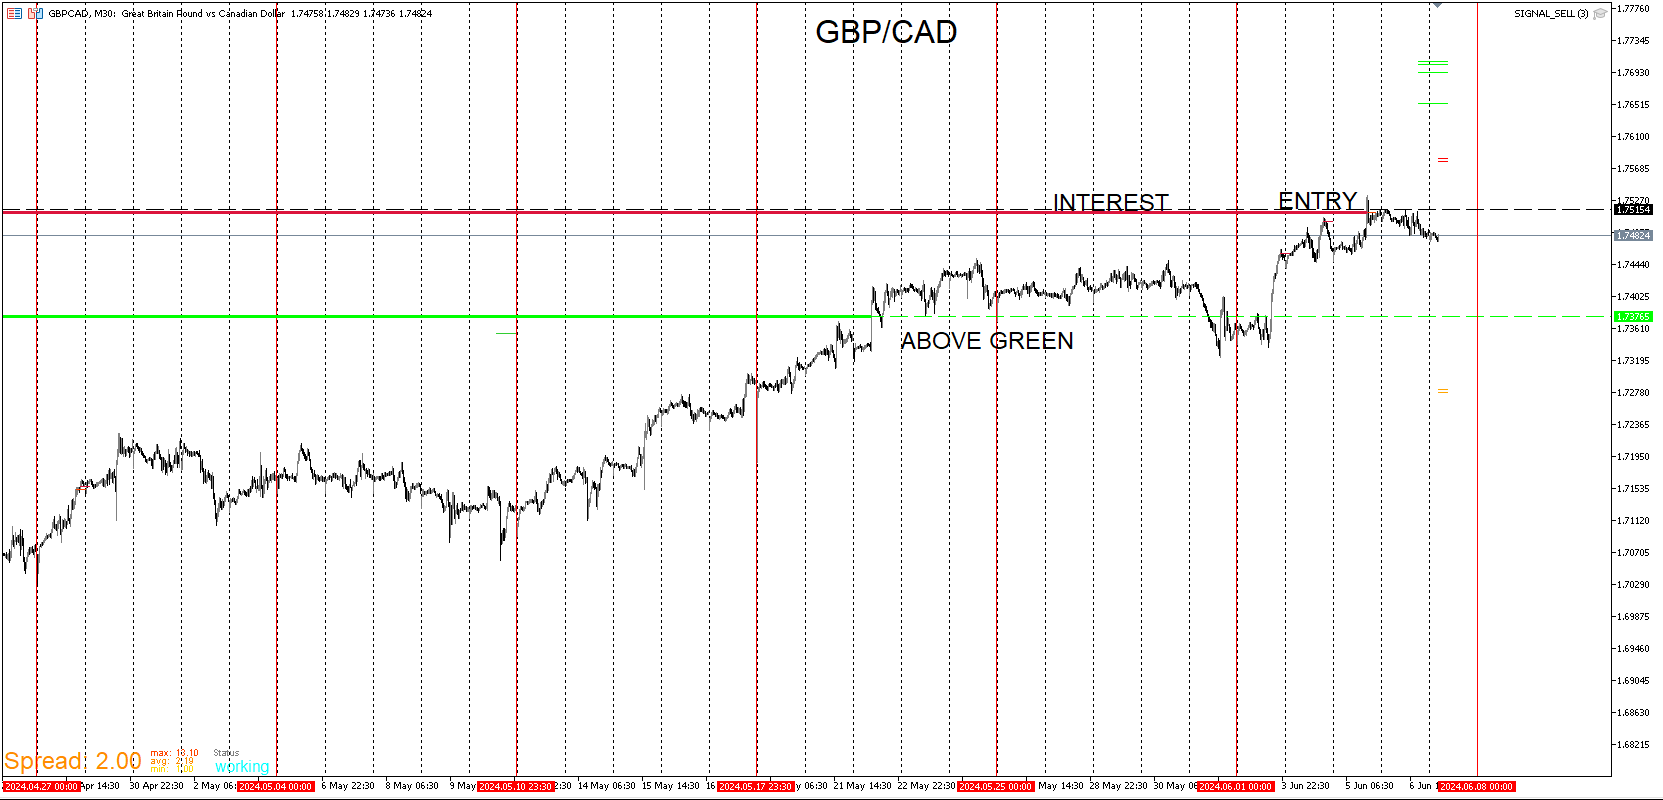
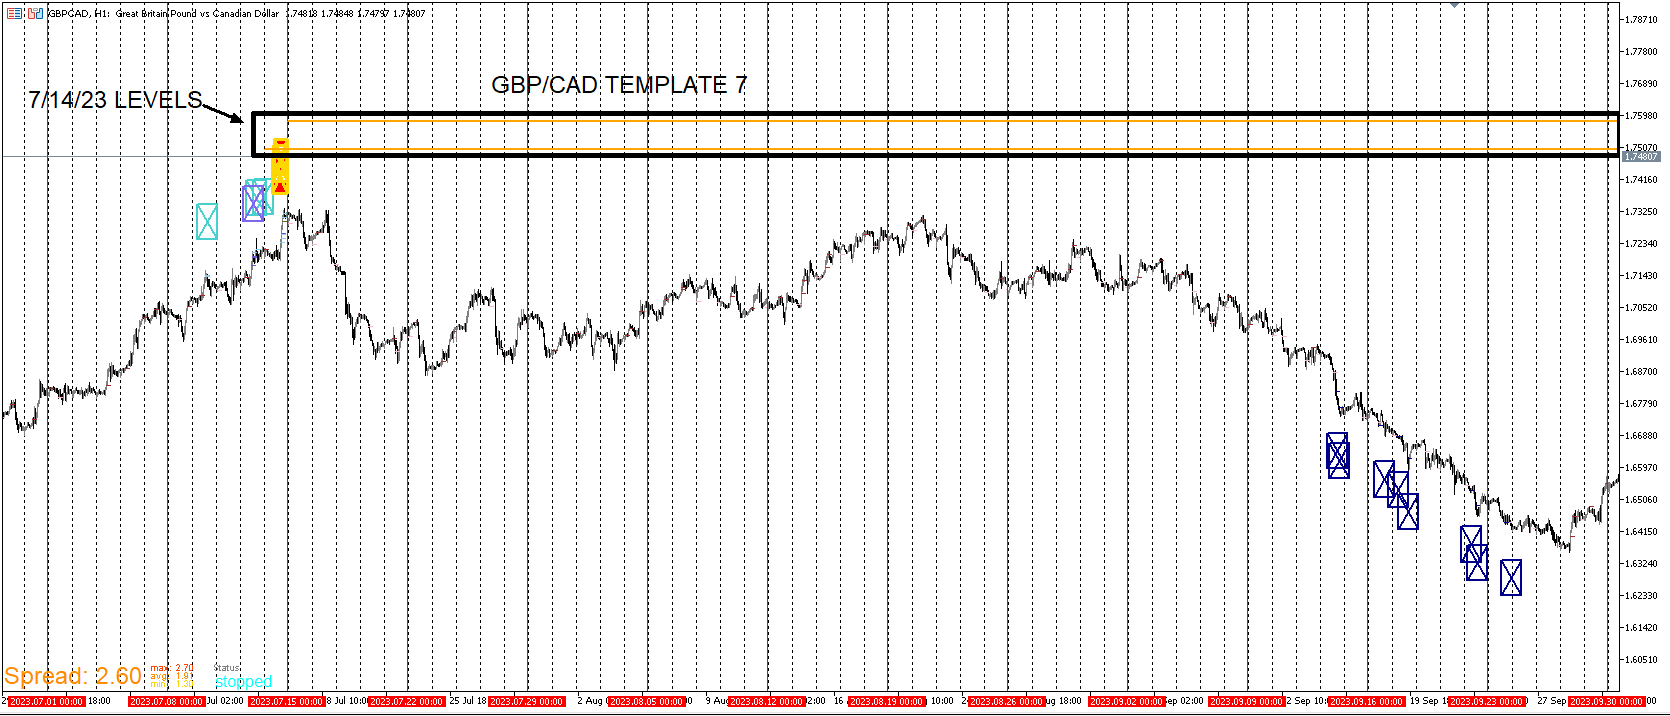
      Here I will go further into my short bias for GBP/CAD. This is another example of blending templates together to get the most optimal entry. I make assumptions based on these levels that are generated by the EA's.

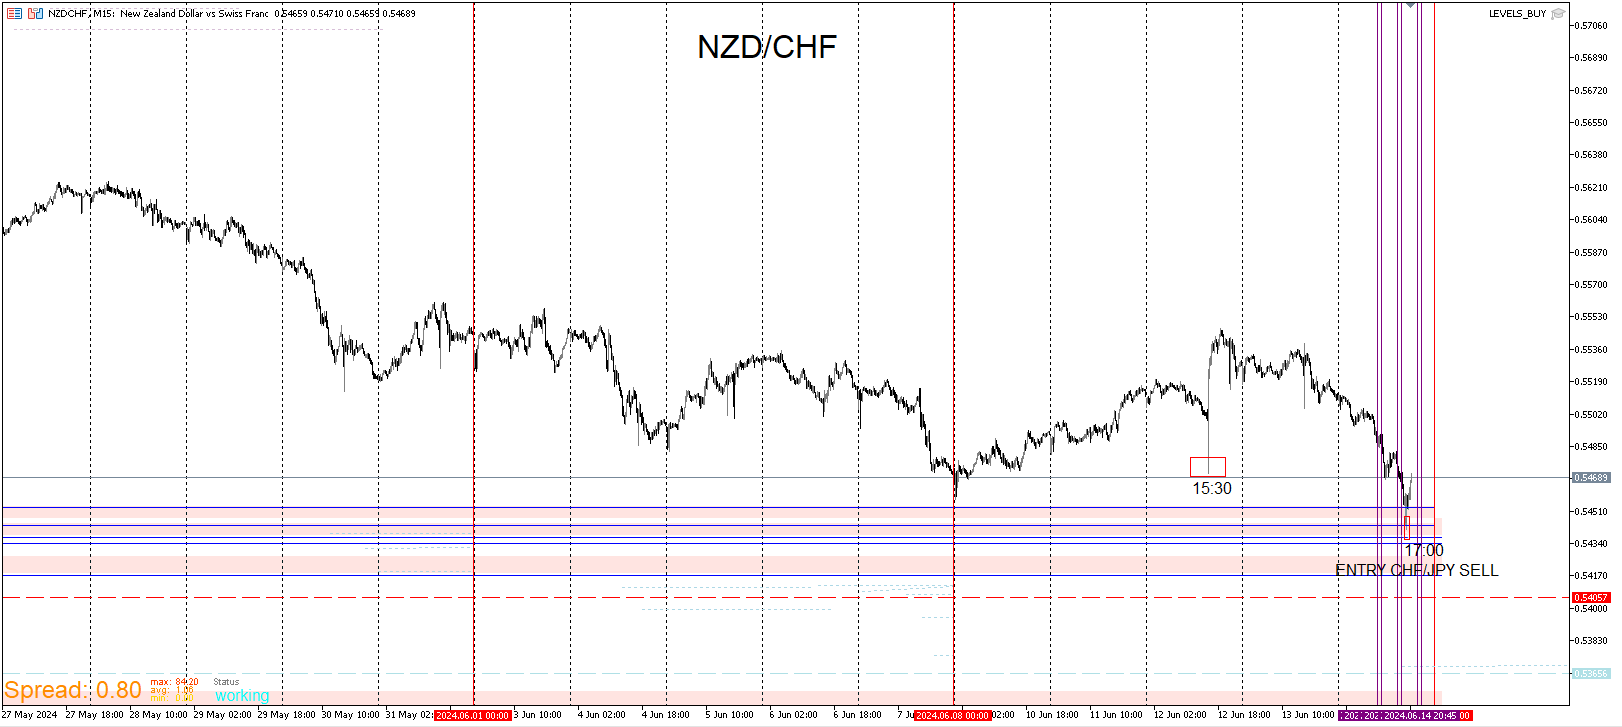
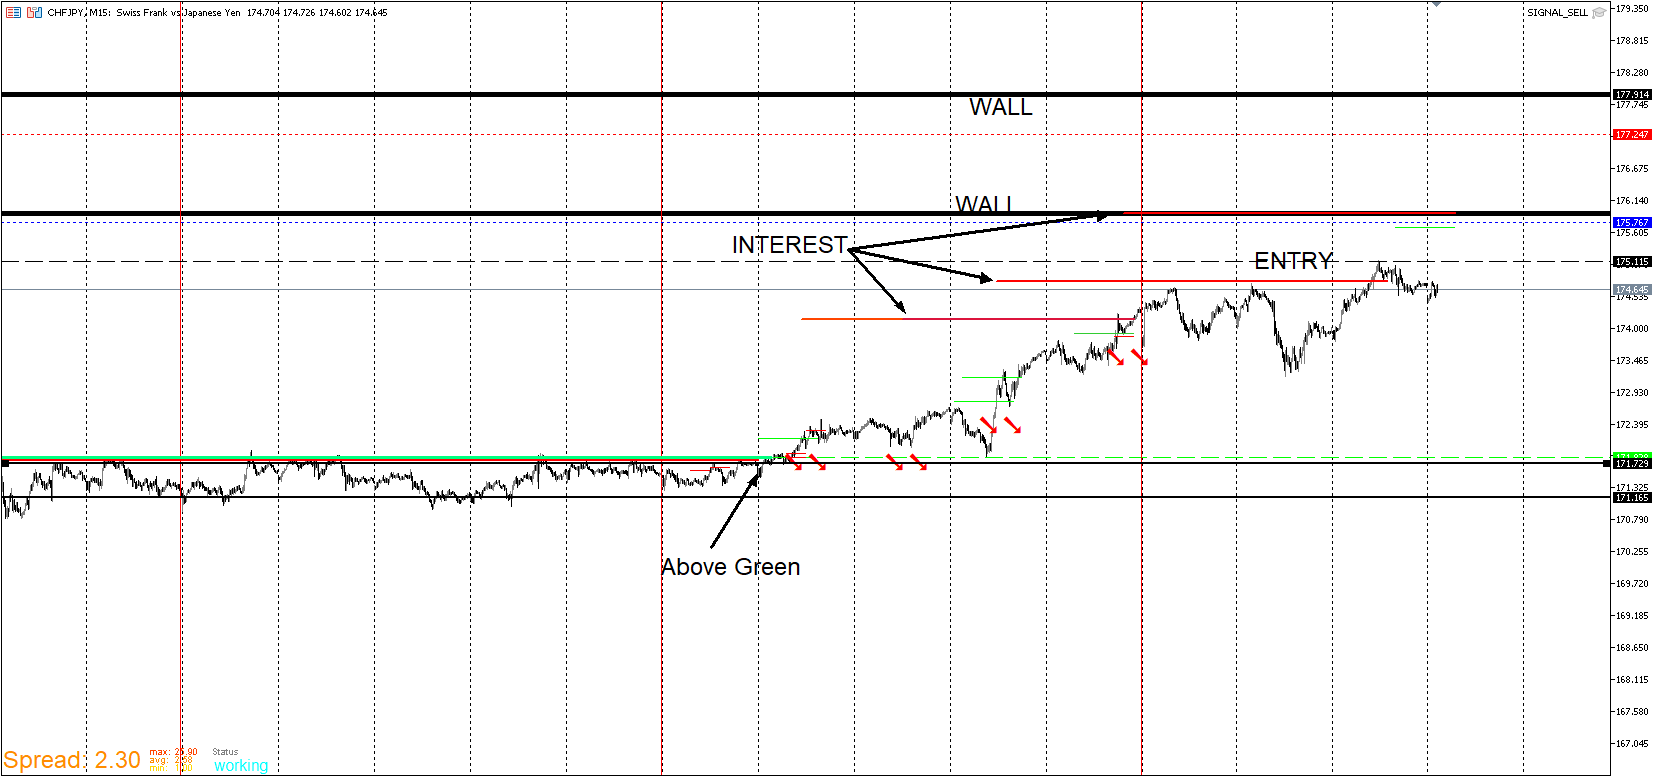
      Green Line- In this sell bias, I don't look for price to reject from it to the tick. That's a rare case. I need to see price accumulate past it. I may not know when to enter but what I do know is that every reversal that make a big move, this is an indication of it coming. That can't be denied.

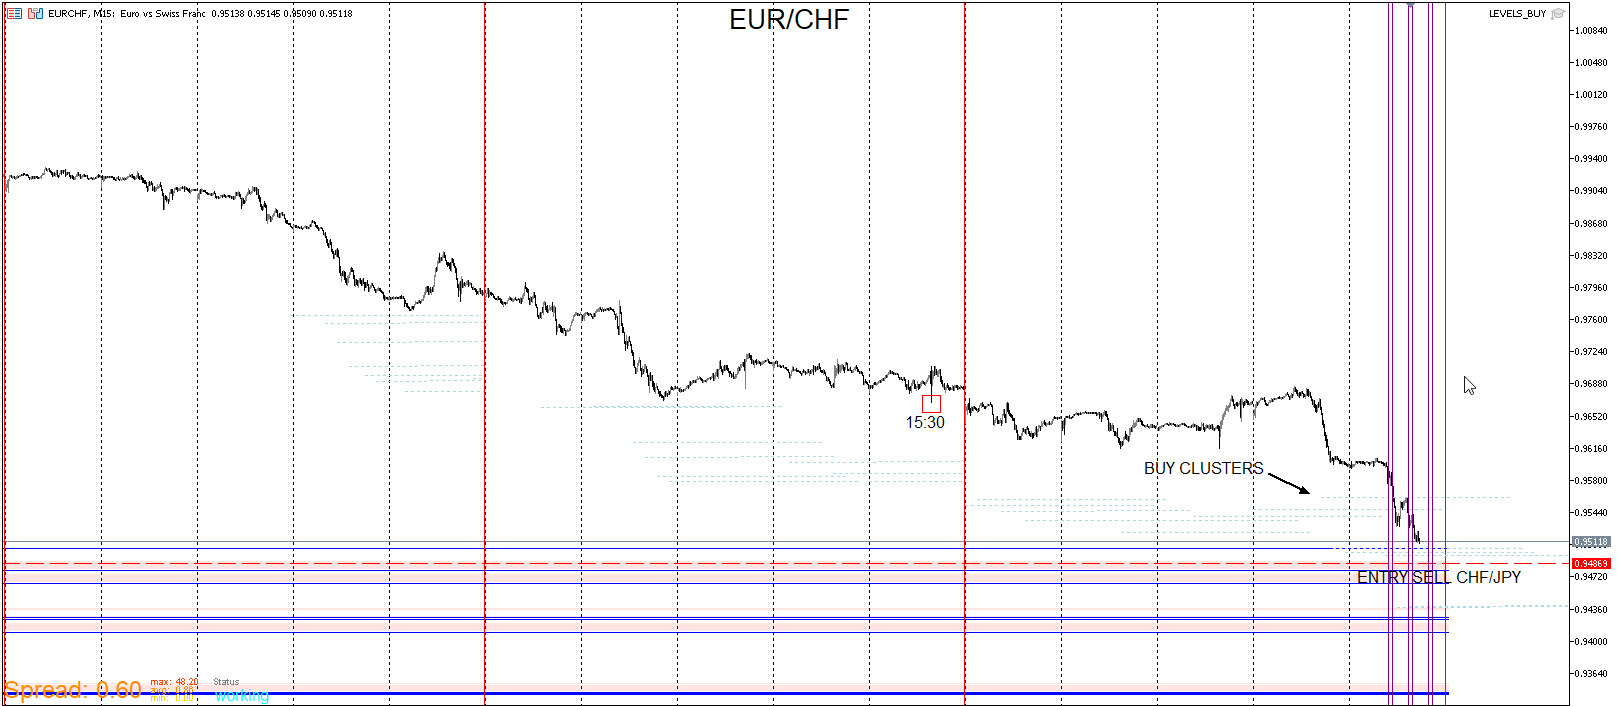
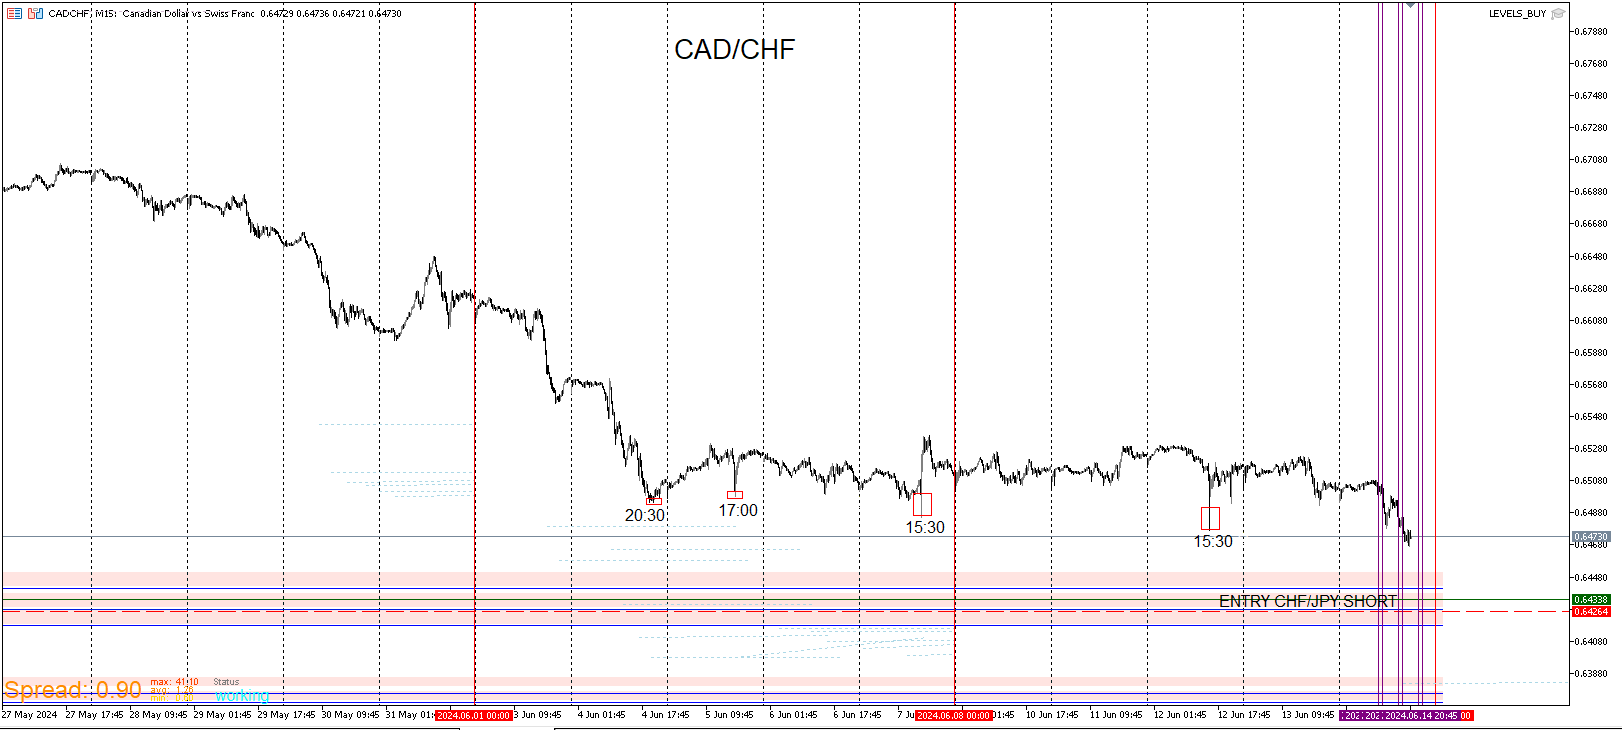
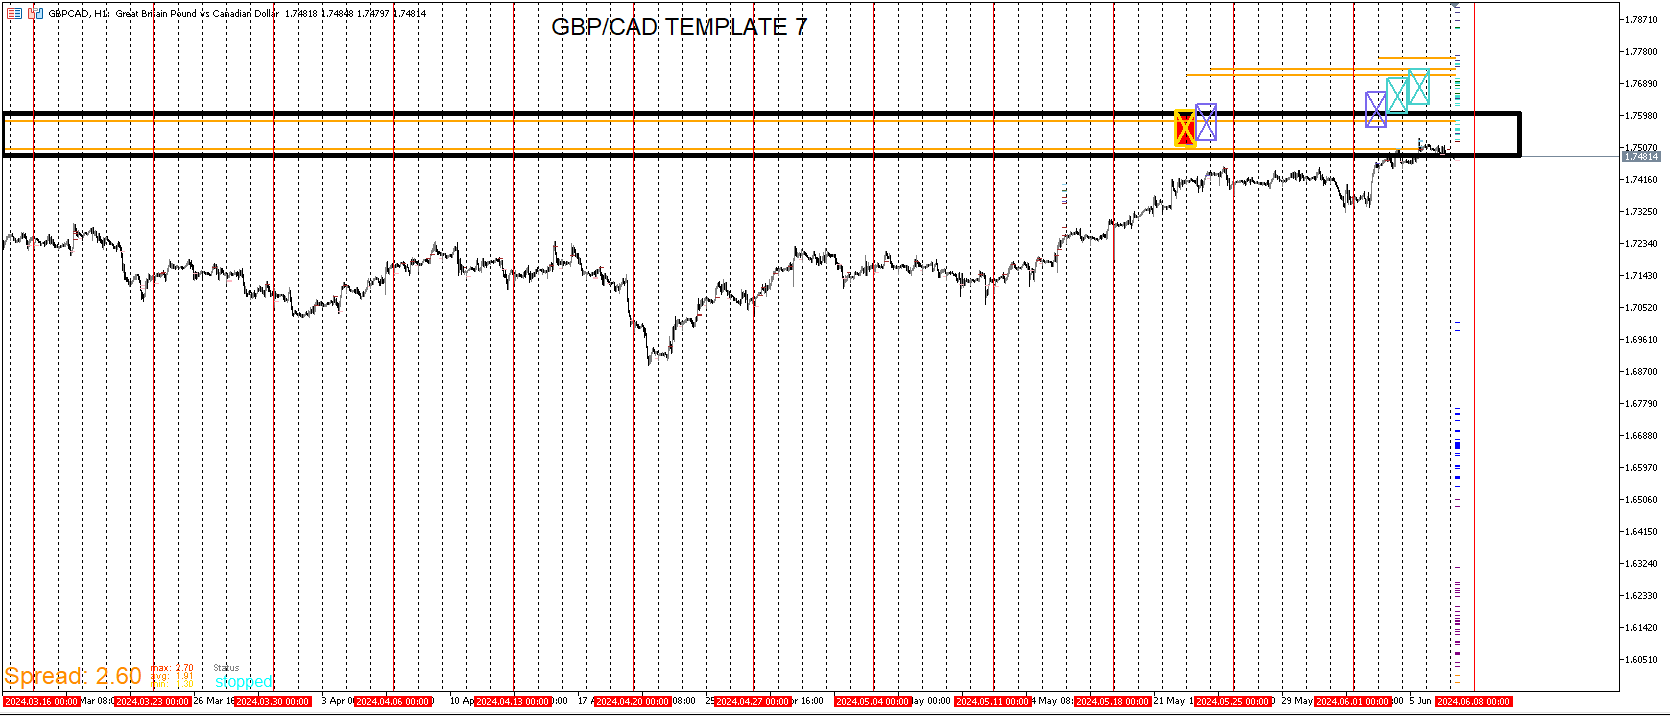
      Orange Levels- Notice how they are right on top of the green line. This is one purpose of implementing the green line so that it would filter out entering on what I believe to be a strong level. The best entries are behind the orange levels. The Gold Symbol helps visualize when those orange levels are breached.

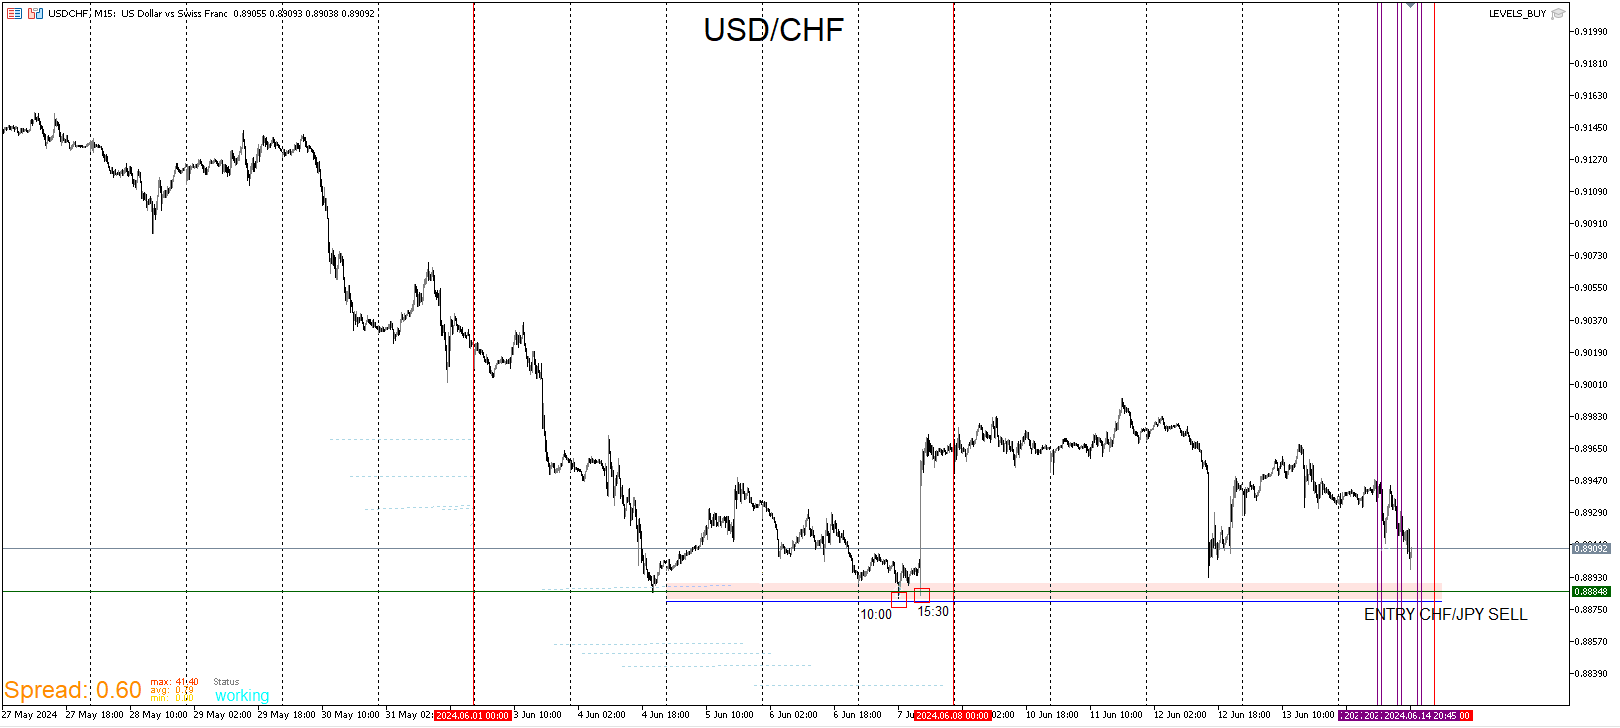
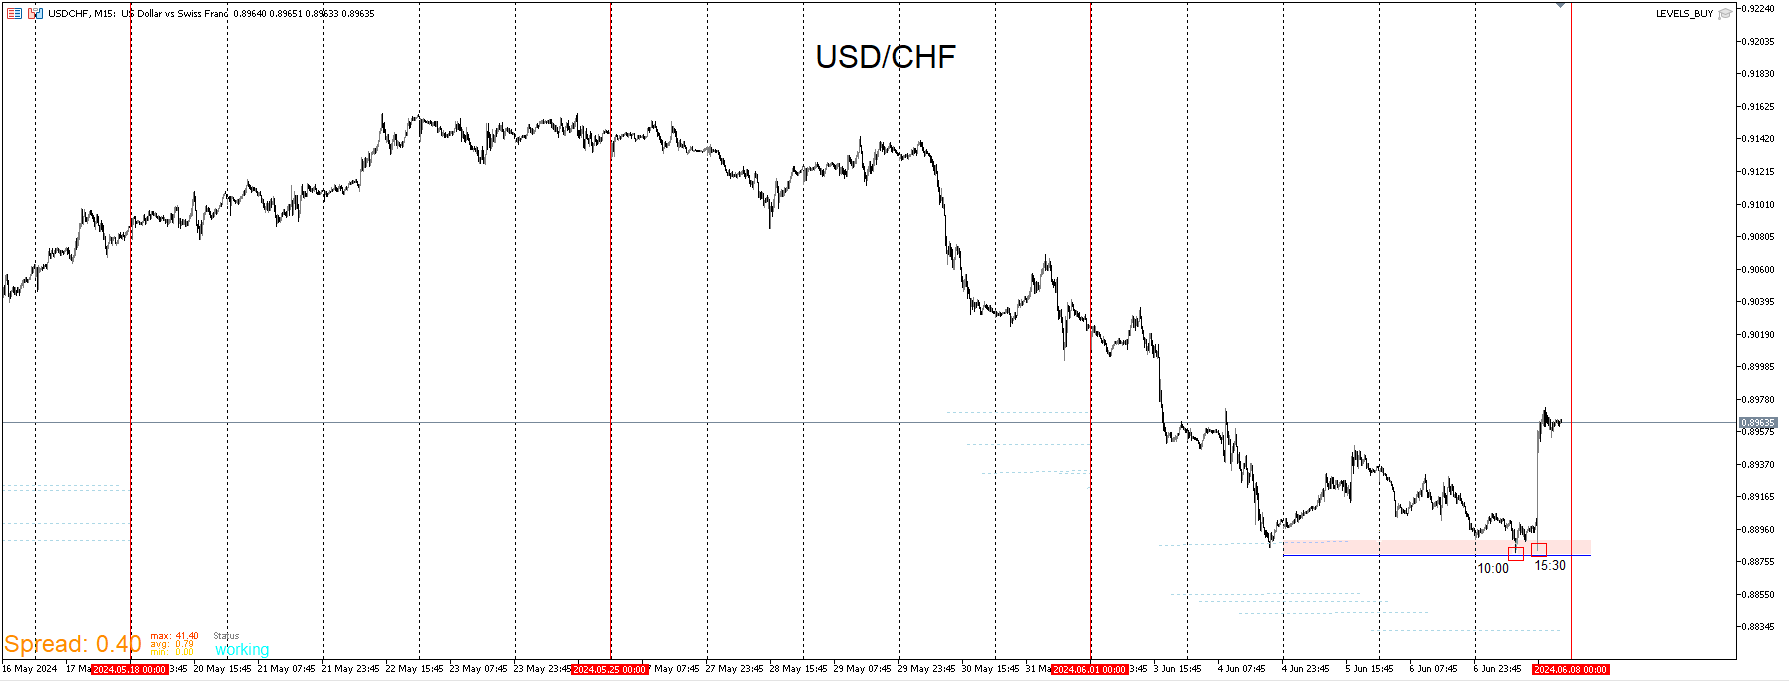
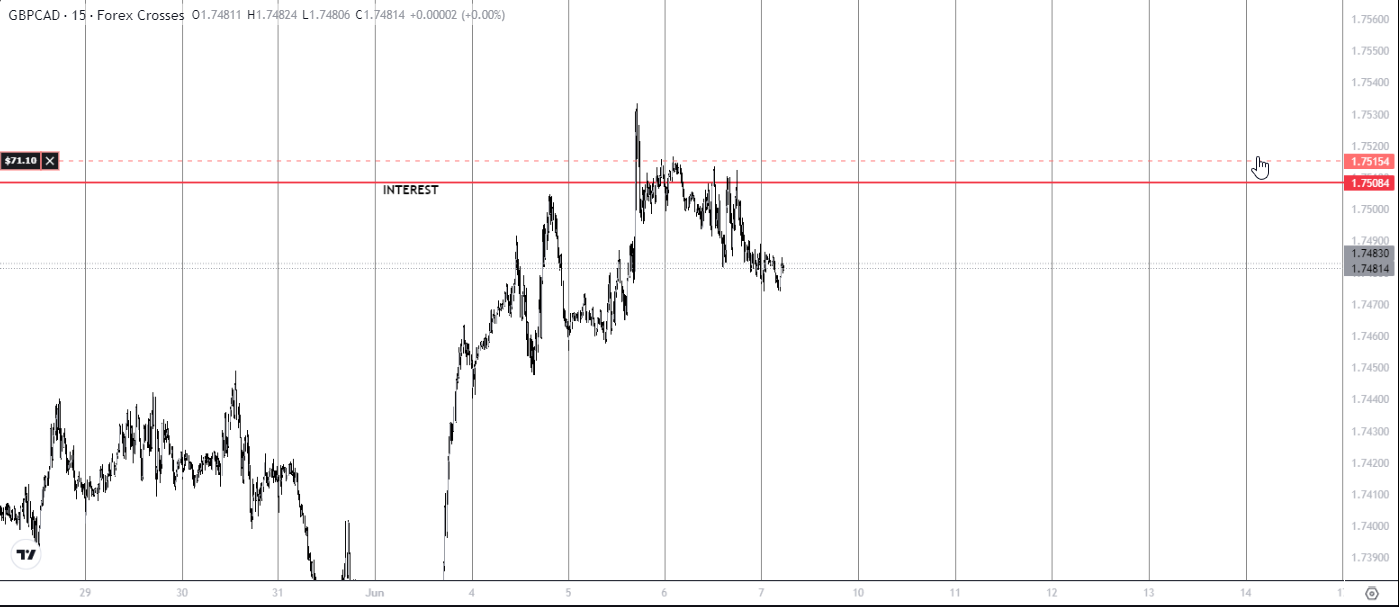
      Interest- Interest combined with these other confirmations gives me more confidence. On top of that price is strattling along it as well as converging with levels from 7/14/2023 which usually show to be well defended on first contact after a long time.

      I'm already short from these zones so I will just hold. There's always the possibility of price pushing up but this is how my eyes are trained to spot reversals and too many elements are lining up to not take the entry. Any pump up past last week's high I see as a selling opportunity.

      GBPCAD_INDEPTH.png

      posted in General Discussions
      J
      JayPhillbrooks
    • RE: My EA update

      @DragonZueloTrends I can see why it gives that impression. And yes Break of Structure and Change of Characters are viable. The problem is that like any other strategy or analysis, every one of them shouldn't be take because by doing so isn't profitable in the long run. My method generates levels that gives solid likelihood. Even then there's still discretion and other things must line up. These levels can generate around/below BOS zones and CHOCH. They also don't. You can spot a BOS but how do you know when the best time to enter? Price can reverse 5 pips below or 500. None of my EA's look at market structure.

      posted in General Discussions
      J
      JayPhillbrooks
    • RE: My EA update

      @DragonZueloTrends No not at all. It looks that way but it's actually an opening range strategy that draw those zones out. I have a sell version as well. I've heard about supply and demand stuff but it's just not how I analyze.

      posted in General Discussions
      J
      JayPhillbrooks
    • RE: My EA update

      Here is a continuation example. It's a basic explanation of what I look for assuming that a bottom was put in. Lets say if I missed the bottom. More times than not, price will come back down and get underneath the positions that gone long. This can take few weeks to set up so patience is necessary. Each entry should be underneath positions that has already gone long. The times still apply here and are one good way of filtering out which levels are likely to not hold up. Price sometimes come back to the level a second time over the course of a few days. I'm not a fan of buying as price gets higher, but when I do, this is how I go about it.

      BCC_CONTINUATION.png

      posted in General Discussions
      J
      JayPhillbrooks
    • RE: My EA update

      BCC TEMPLATE CHF PAIRS

      USDCHF_BCC.png

      GBPCHF_BCC.png

      CADCHF_BCC.png

      EURCHF_BCC.png

      posted in General Discussions
      J
      JayPhillbrooks
    • RE: My EA update

      The latest template I've been working on is the B/C/C Template. It's used to detect potential bottoms, as continuation entries after I believe the bottom was put in a while back, and correlation which I'm still studying and will go into detail later. The idea of these levels which is the blue line and the pink box over it. When price breach these objects, they are supposed to delete which it does most of the time. Rarely I'll enter on these levels but what's most important is when they stay intact. And when they do stay intact and price pushes up, what time did the cross happen. The desired times are displayed in the image. For example from 10:00 to 10:30 are desired times. So it can happen at 10:00 or 10:30 and anything in between that. That doesn't mean that it doesn't happen on other times, It does but rarely and price usually comes back down. I need to test this more but so far these times offers better probability. These examples aren't exact at every time. Like other patterns in price movements, there are variations and nothing is the exact same but behaviors can be similar.

      1st question: Is price approaching the level? Yes
      2nd question: are other pairs of the the same currency approaching their respective levels? Yes
      3rd question: Did majority of the pairs breach the level but the levels remain intact? Yes
      4th question: Did the crosses happen during the desired times? Yes
      5th question: Is my Bias Long based on other templates even though some conditions may not have been met in those other templates? Yes
      6th question: Do I have a short bias on a pair that has total opposite correlation? Yes

      With Yes being the answer to all of those, I will place the trades. Whether it works out or not, these are the types of setups I will take like a robot.

      BCC_TEMPLATE.png

      posted in General Discussions
      J
      JayPhillbrooks
    • RE: My EA update

      I am long the CHF pairs now and will go into detail to why I entered. Except for AUD,CHF and NZD/CHF I believe that those two pairs will still push down more

      AUD/CHF ENTRY: 0.58654
      NZD/CHF ENTRY: 0.54399

      posted in General Discussions
      J
      JayPhillbrooks
    • RE: My EA update

      I have recently taken a GBP/CAD sell utilizing the interest template and Template 7.

      GBPCAD_ENTRY.png

      GBPCAD_TEMP7.png

      GBPCAD_TEMP7_2.png

      GBPCAD_LIVE.png

      CHFJPY_LIVE.png

      posted in General Discussions
      J
      JayPhillbrooks
    • RE: My EA update

      @DragonZueloTrends Unfortunately no links. I put a lot of time and trial and error creating them.They are all completed projects and this thread exist to display the predictive capabilities of them all combined and used correctly. I'd be happy to lease everything as a package. But first there needs to be documentation of forward testing of at least a year before that's possible.

      posted in General Discussions
      J
      JayPhillbrooks
    • RE: My EA update

      I didn't enter on any of the JPY pairs a few weeks ago. I did just enter a CHF/JPY sell. If it continues to push up, I have better entry zones assuming that it squeezes up the next two day. I prefer to see a longer up trend after that high was put in on 4/29. I entered recently in case it don't push up further soon.

      CHFJPY_WALL.png

      CHFJPY_CLUSTERS.png

      Here is the temp 4 version.
      In an uptrend if I'm expecting a reversal, the blue and red dotted lines are where I predict the high to be put in place. If price gets here rapidly in a day or so, I will sell from these zones.

      CHFJPY_TEMP4.png

      CHFJPY_INTEREST.png

      posted in General Discussions
      J
      JayPhillbrooks
    • RE: My EA update

      I touched on Template 4 in my earlier posts. I'm using it as a continuation setup also. The blue dotted levels as well as the purple dotted are assumed to be strong levels to enter around. Sometimes price continues through, but it's rare. I still think it's more likely that price will resist the wall. There's a chance it may come close, but I'm not seeing it break and continue. Also I'll note that when price aggressively pushes down toward the beginning of the blue or purple dotted lines, that makes a reversal more probable especially if it crosses before the start of it. There are also interest levels both old and new. Price may not hit them but rather come close.

      USDCHF_TEMP4.png

      EURCHF_TEMP4.png

      GBPCHF_TEMP4.png

      CADCHF_TEMP4.png

      posted in General Discussions
      J
      JayPhillbrooks
    • RE: My EA update

      The pink boxes and blue lines are indicators that I will explain later.

      USDCHF_CLUSTERS.png

      EURCHF_CLUSTERS.png

      GBPCHF_CLUSTERS.png

      posted in General Discussions
      J
      JayPhillbrooks
    • RE: My EA update

      Here's one of the new indicators that I refer to as the Cluster Temp. When price enters these zones I look to enter but only if other templates are confirming. It's rare that price enters these zones and sometimes it turns just short of it. I'm only interested when price digs into them. Usually when price does reverse, It does so aggressively. A small number of candles can undo the a day or two worth the price movement it took to get there. Depending on how likely I see a reversal, these zones are where I want to enter. Buys are the powdered blue, Sells are the thistle color.

      CLUSTER_TEMP.png

      posted in General Discussions
      J
      JayPhillbrooks
    • RE: My EA update

      I'm back with a few updates on some upcoming entries I'm about to take. It's been a while since I last posted because I haven't been seeing what I look for. I did miss a couple of opportunities but I've been mainly focusing on building a couple more EA's that I'm ready to showcase. But first I will display the wall templates for some of the CHF pairs. It's only 3 but these three are the main ones needed because they drive the rest. Price is approaching the wall on each one but I don't expect price to get there because though price can get in the area of the wall, It's rare that price breaks it. I will blend them with other templates to get what I believe to be good entries. I see this as a continuation setup with a subtle rollover.

      USDCHF_WALL.png

      EURCHF_WALL.png

      GBPCHF_WALL.png

      posted in General Discussions
      J
      JayPhillbrooks
    • RE: How to draw an object on another active chart

      Did you solve the issue?

      posted in Questions & Answers
      J
      JayPhillbrooks
    • RE: Pending order

      @Nazmul901 As Jstap said, create a set of rules to define those levels. Just know that whatever you are trying to do, there will be a ton of whipsawing. With that being said, I'm still happy to help but you have to start the first step of determining what create those levels.

      posted in Questions & Answers
      J
      JayPhillbrooks
    • 1
    • 2
    • 3
    • 4
    • 5
    • 6
    • 7
    • 8
    • 9
    • 10
    • 6 / 10