@VHV-Profit-Masters Is this a practice type of thing or are you looking to make this into an actual strategy? I solved your initial issue but after looking into it, there are other issues that should be much bigger concerns.
J
Posts made by JayPhillbrooks
-
RE: Please help me solve this! I need to draw a short line at the high of the candleposted in Questions & Answers
-
RE: Please help me solve this! I need to draw a short line at the high of the candleposted in Questions & Answers
First, change the line style to the regular solid one or set the width to 1 for the dotted. You can't go above 1 in width for dotted or dashed. That's just how it is in metatrader.
Second, use the time shift. Shift time 1 back a couple hours and time 2 forward a couple hours. Assuming that everything else is correct, you have to shift the trendline in order to see it. It won't be visible if you don't I believe. -
RE: Bull/bear Candle cross a specific price level.posted in Questions & Answers
Candle 1? Have you tried candle Id 0?
-
RE: Help with EA for Trading New York Session - Using High and Low Levelsposted in Questions & Answers
I have made EA's to identify sessions as well as to place session breakout orders. I can assure you that it's not a profitable strategy no matter what ratio you use. It will get chopped up no matter if it's buying or selling no matter if its at a high or low. I'd be happy to guide you through the getting the visual down at least.
-
RE: How to draw lines with sequential name and by quantity on the graph?posted in Questions & Answers
@OntradingX I'm not sure how to go about it in the way you are describing. The way I would go about it which I do have stuff similar to, I would create the condition for line 1 and use the for each object loop and draw trendline then adjust each one in the adjustment box.
-
RE: My EA updateposted in General Discussions
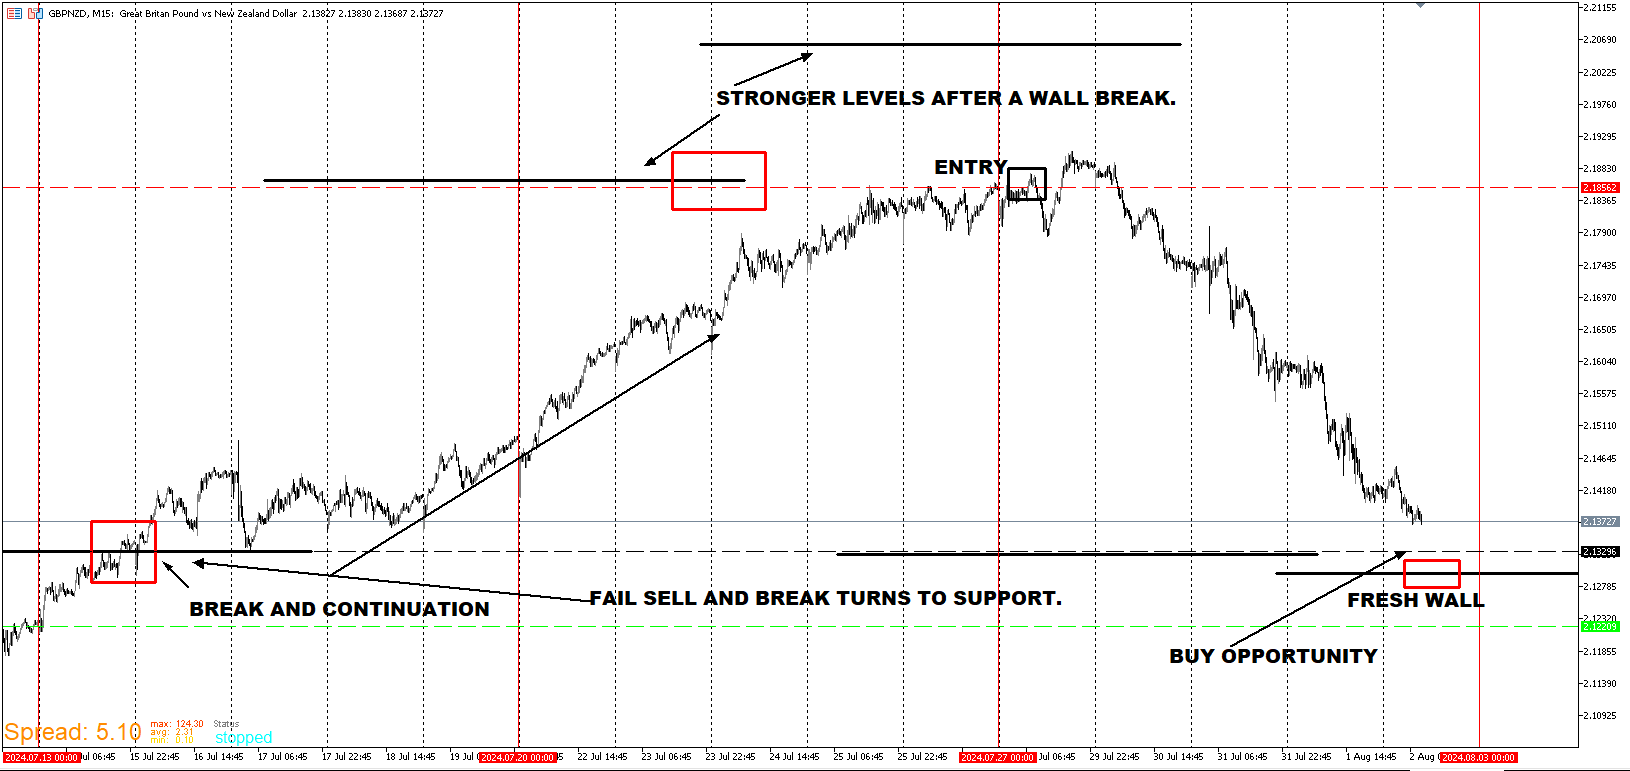
I will take a buy at the previous wall level that was broken. There is a fresh wall underneath as well.
-
RE: My EA updateposted in General Discussions
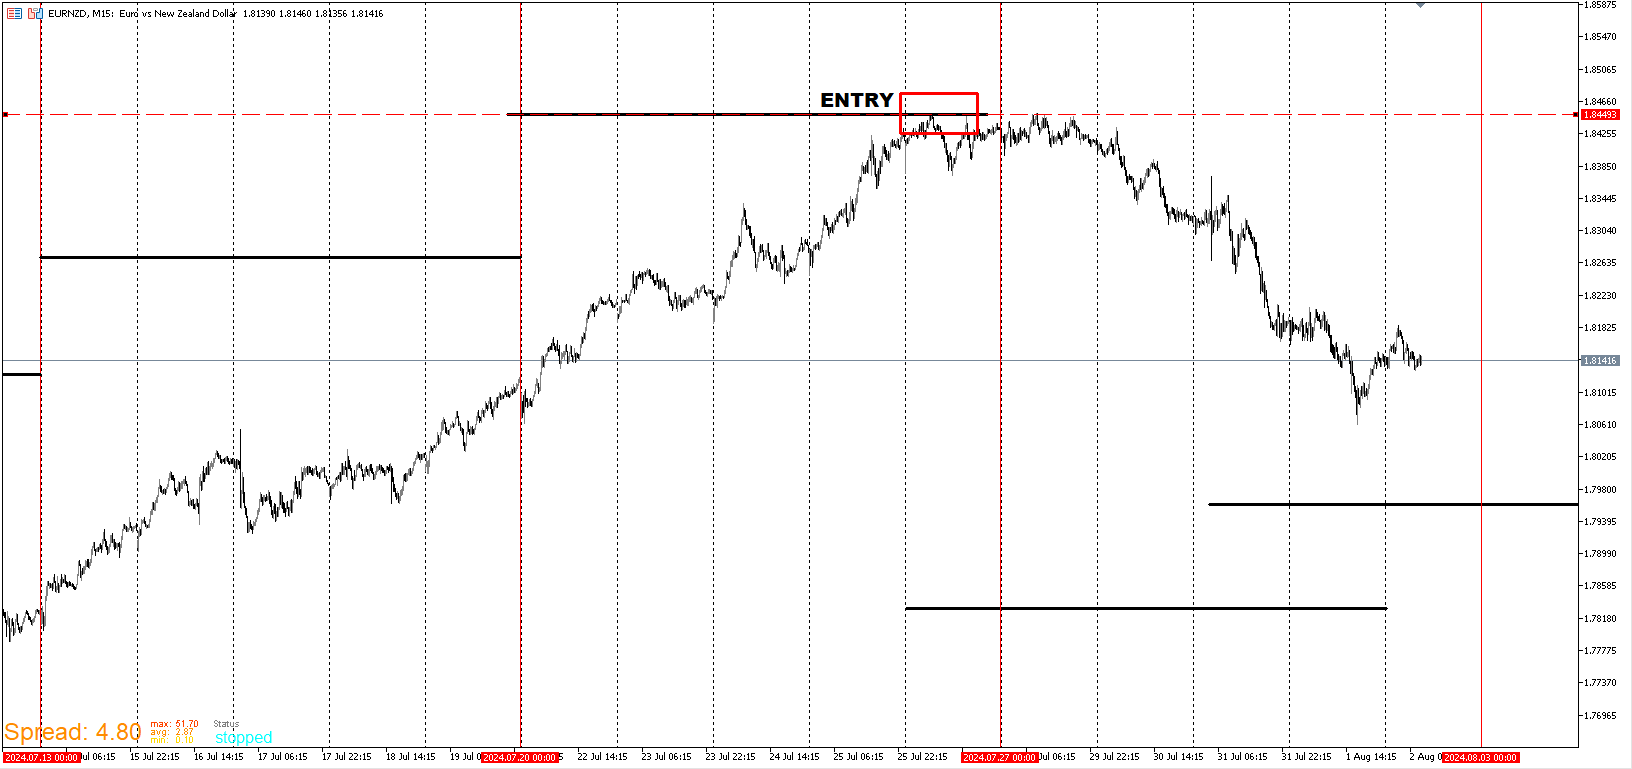
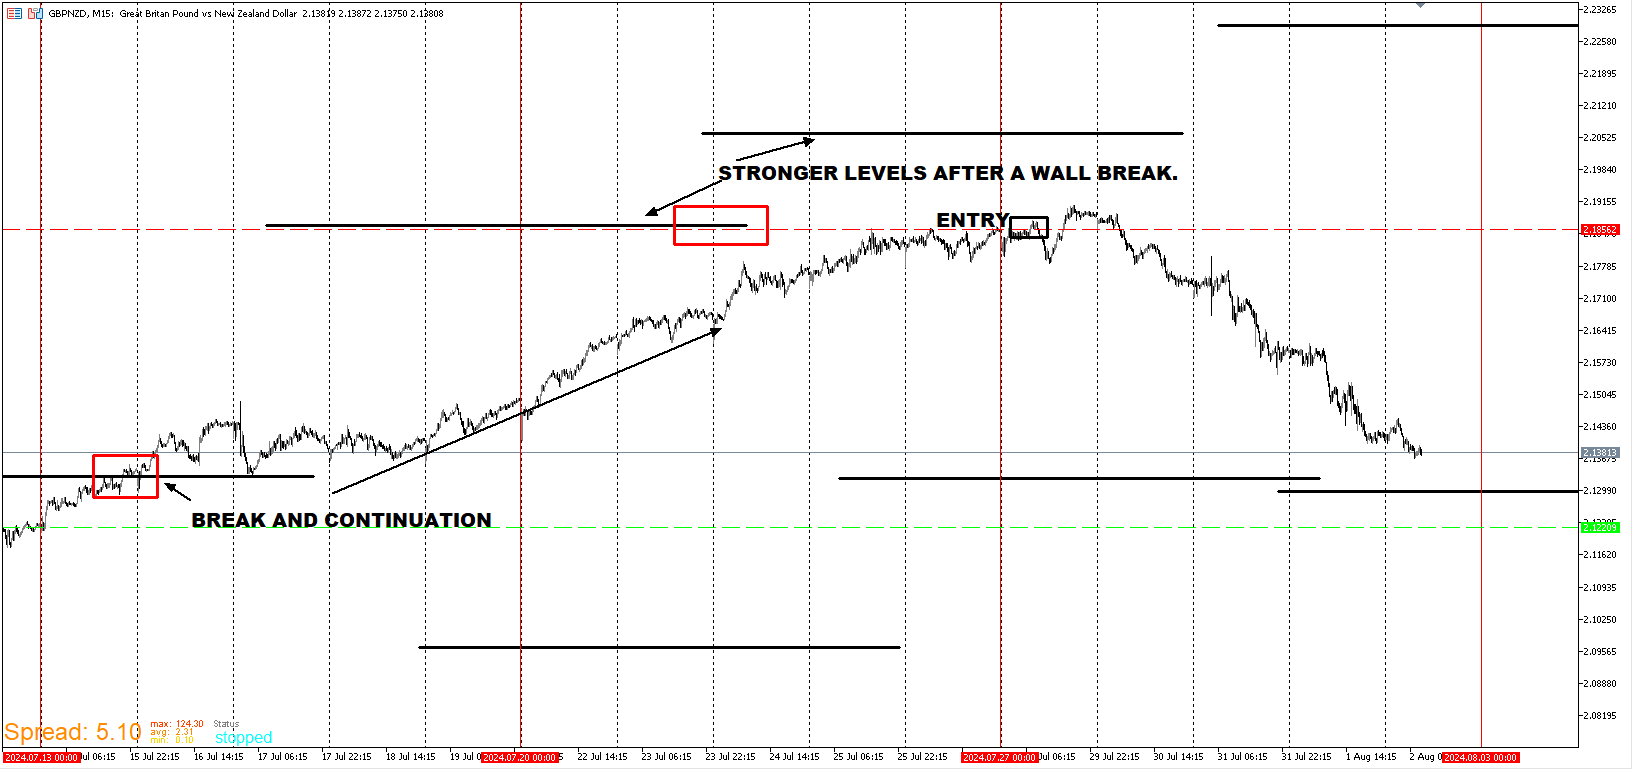
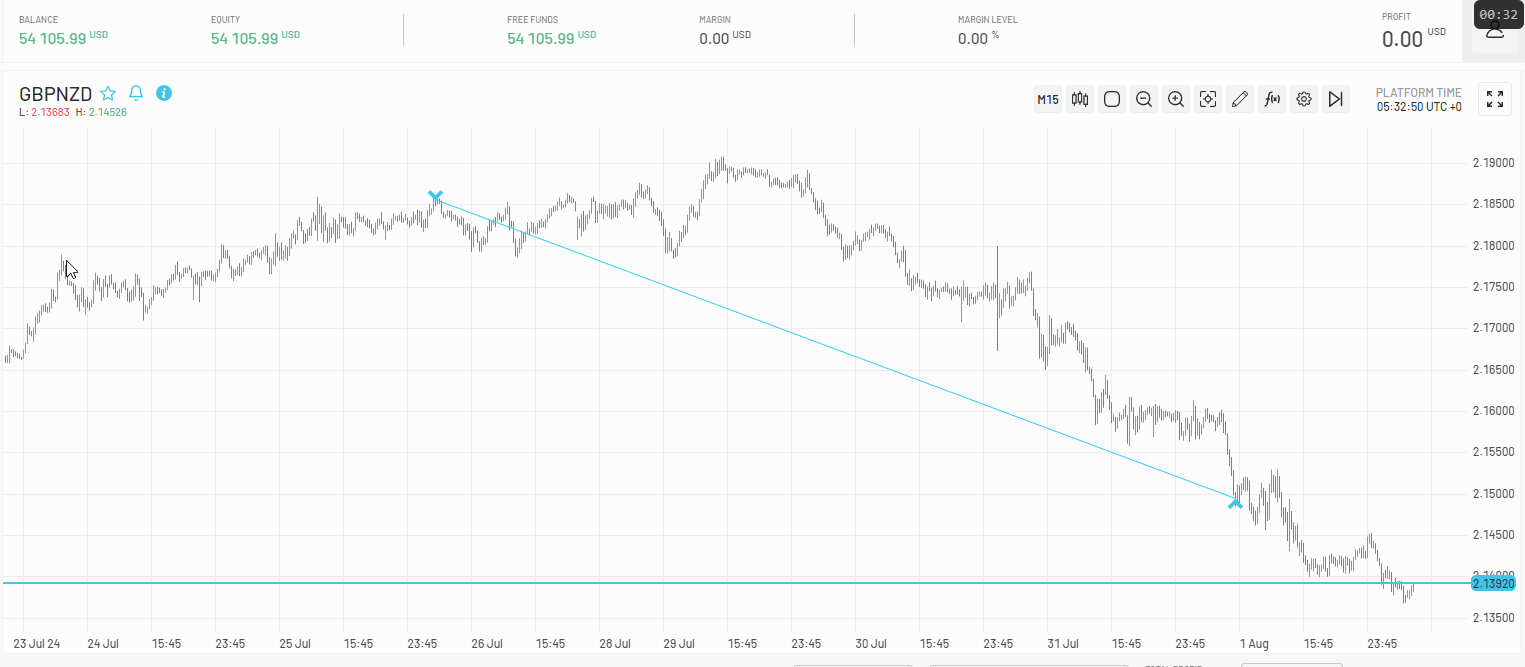
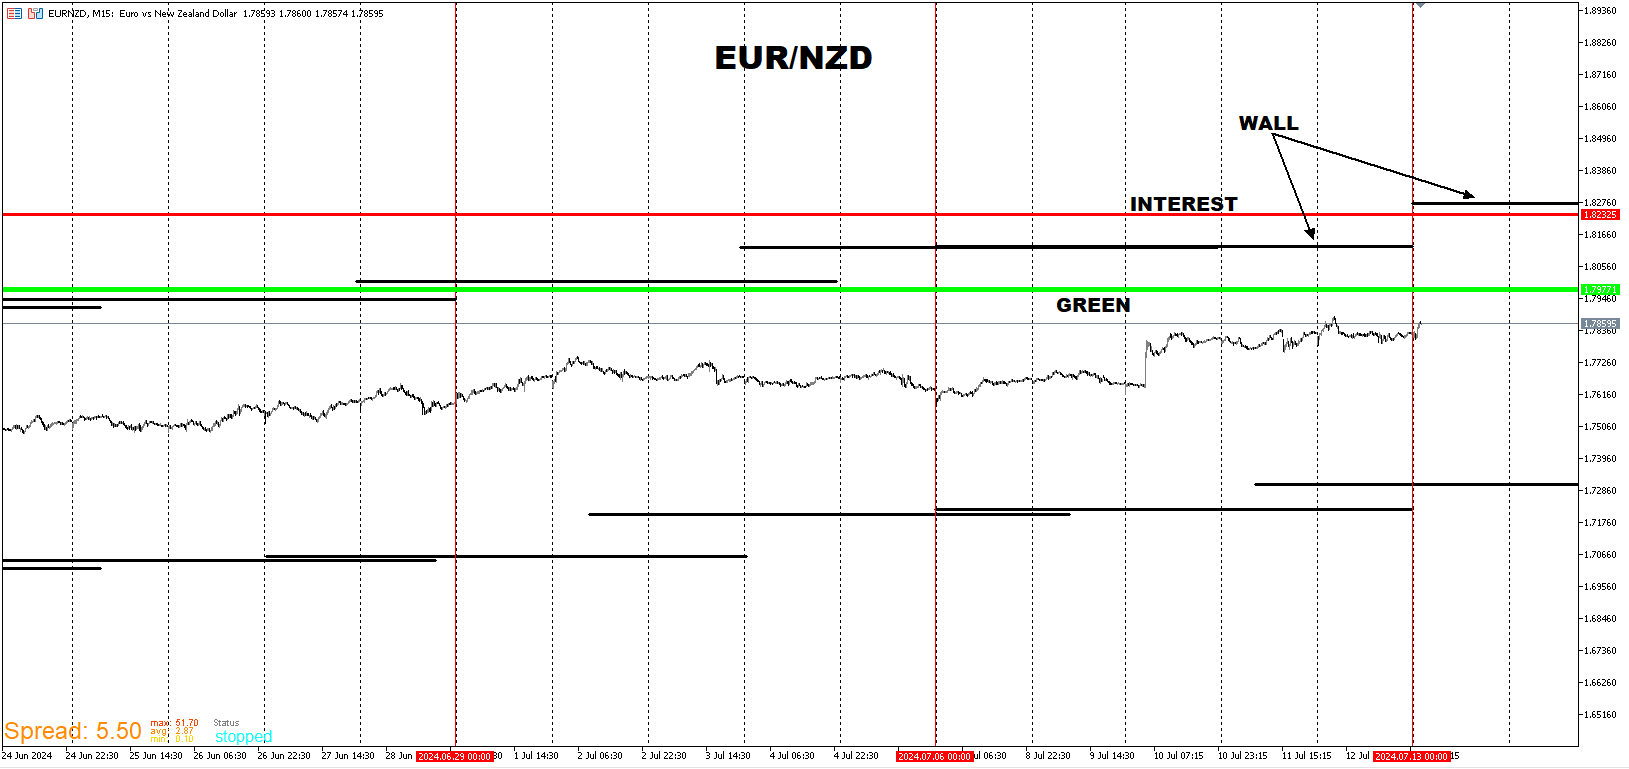
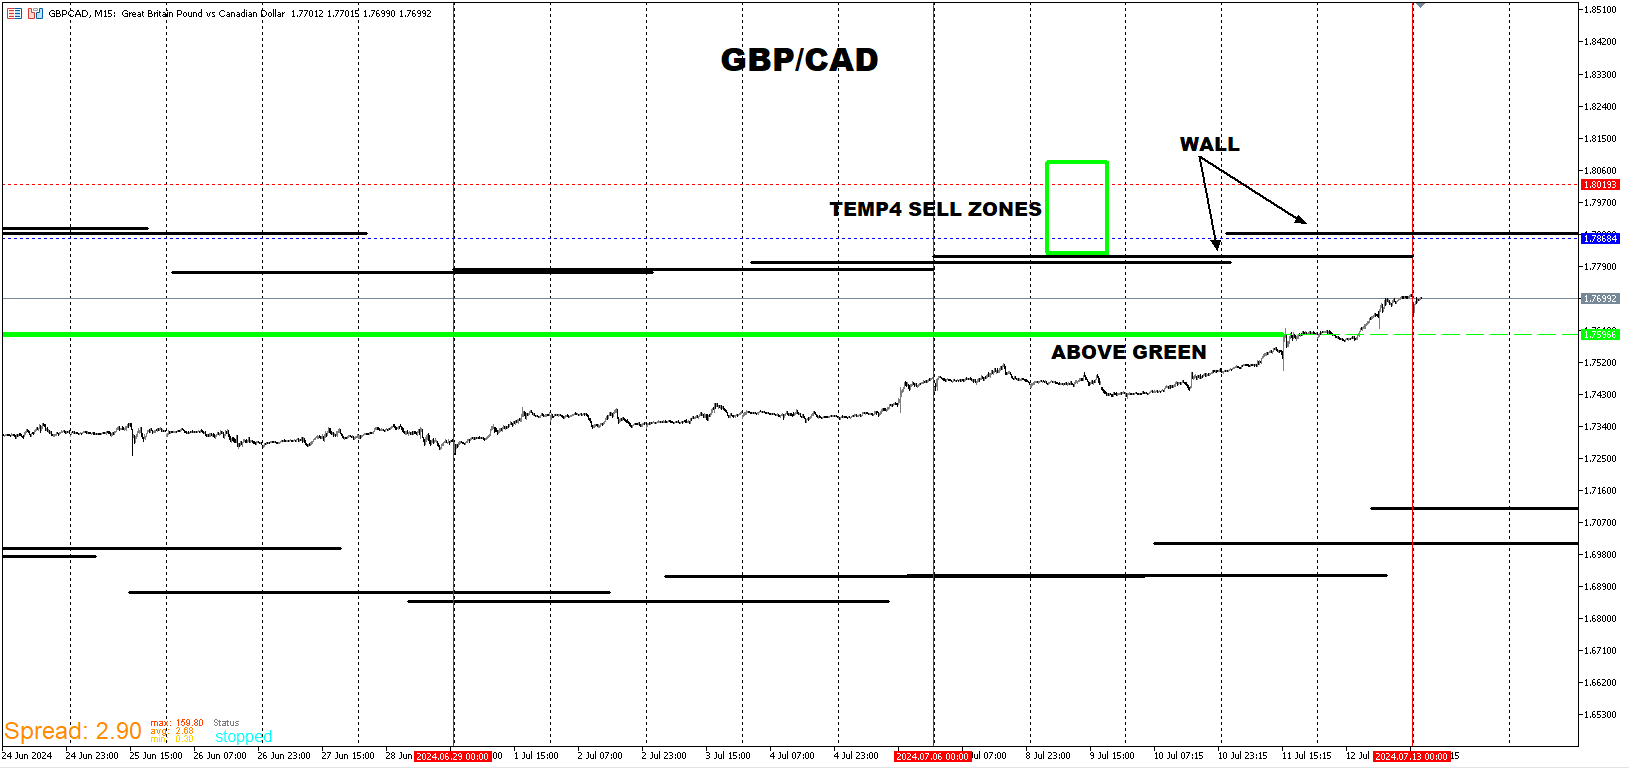
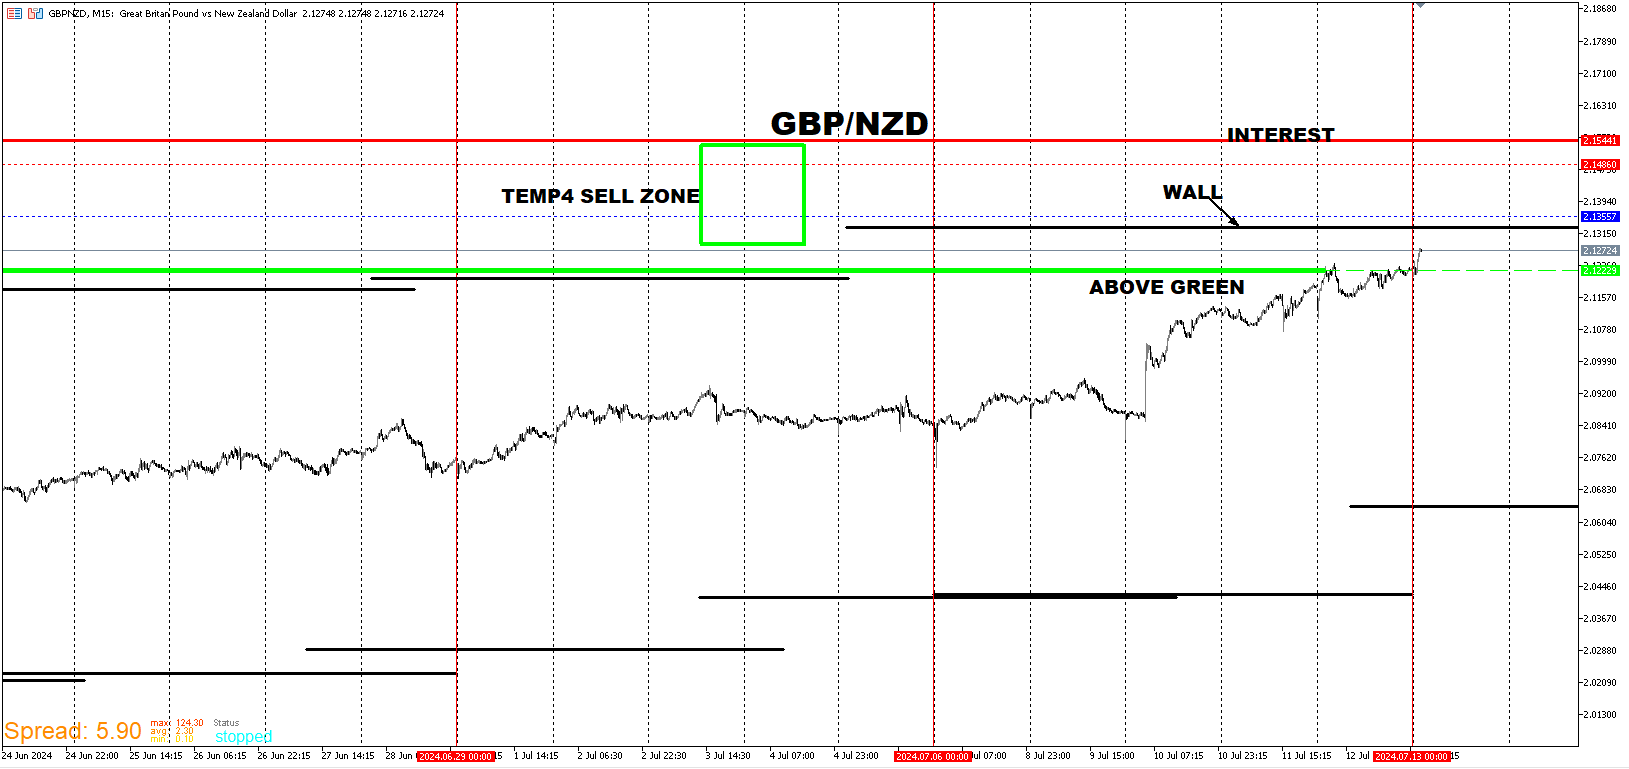
I did post GBP/NZD and EUR/NZD a couple of weeks ago I believe because they were approaching walls but I was looking for an aggressive push up that never happened. I waited and for GBP/NZD, price slowly grinded past the was and done so substantially. I waited up price neared the upper walls and for EUR/NZD to contact a wall. That's when I took the short entries. These entries were taking on an evaluation and passed. I continued short on the second eval but closed with some profit instead of aiming to pass it. The GBP/NZD stop was a bit wider than the EUR/NZD because it tends to extend out more even when both pairs move in the same direction. The goal with these strategies isn't to be right all of the time because it's not possible. But to still be profitable when it's not timed right and the profits come from big moves with little drawdown.
-
RE: My EA updateposted in General Discussions
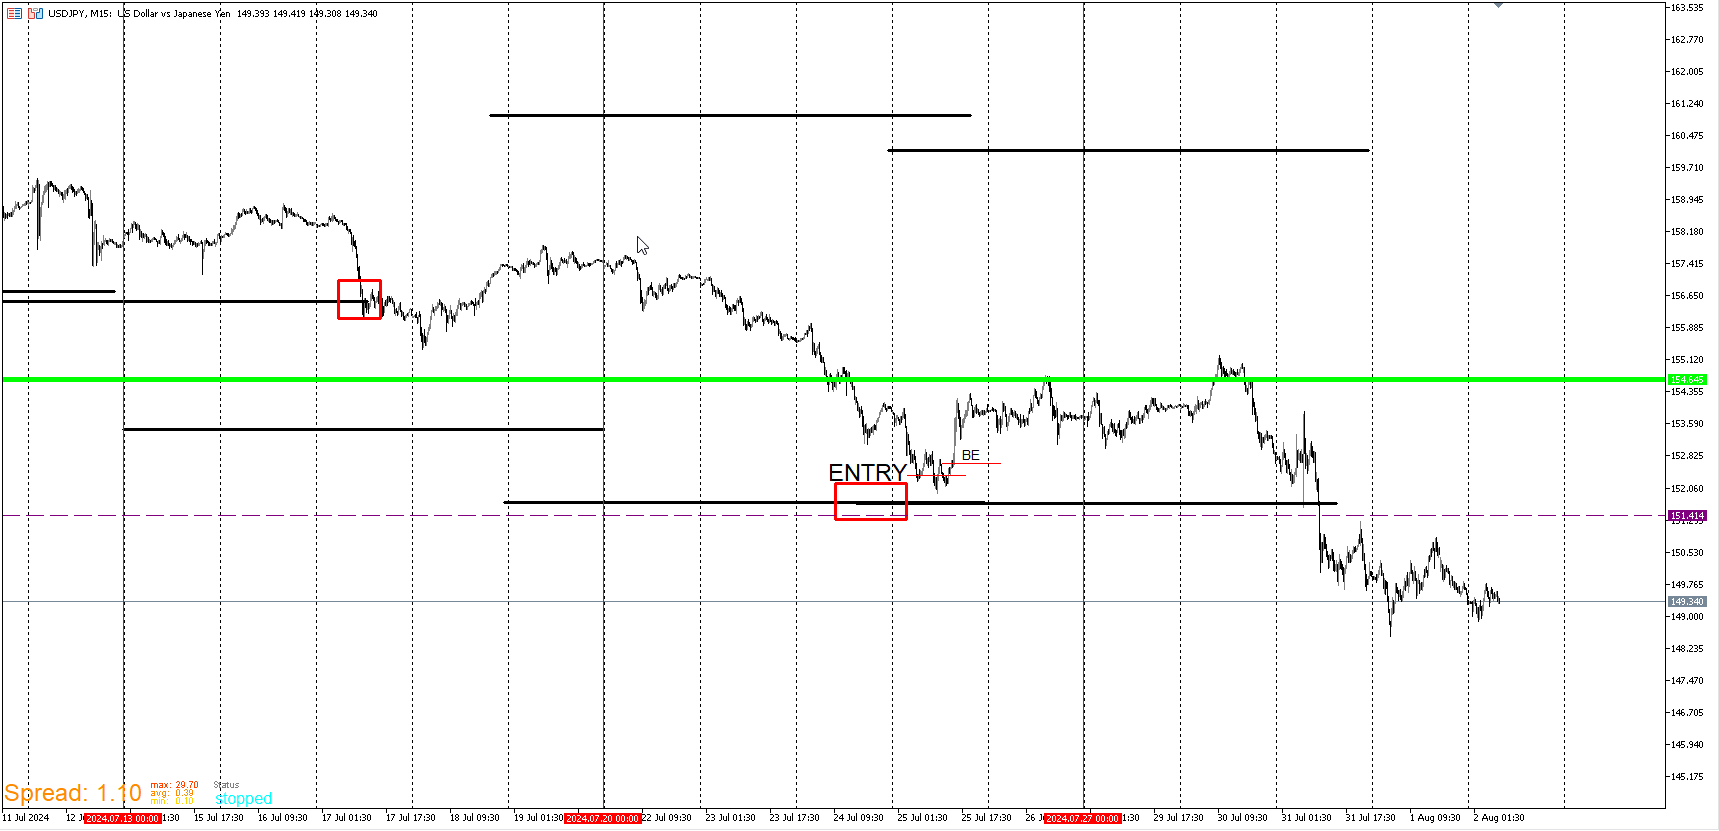
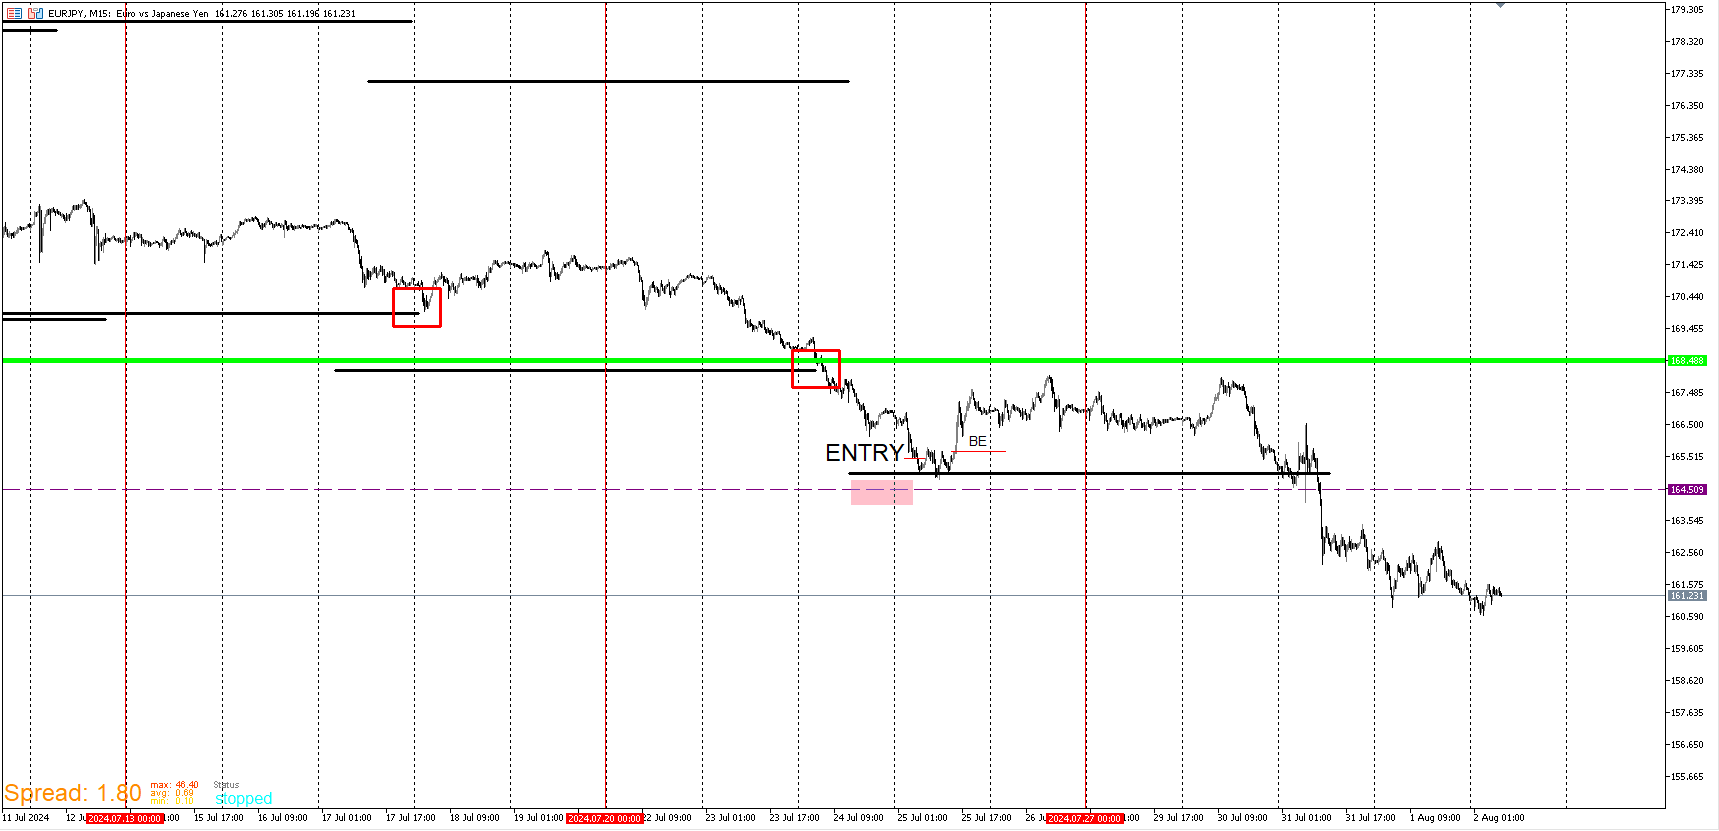
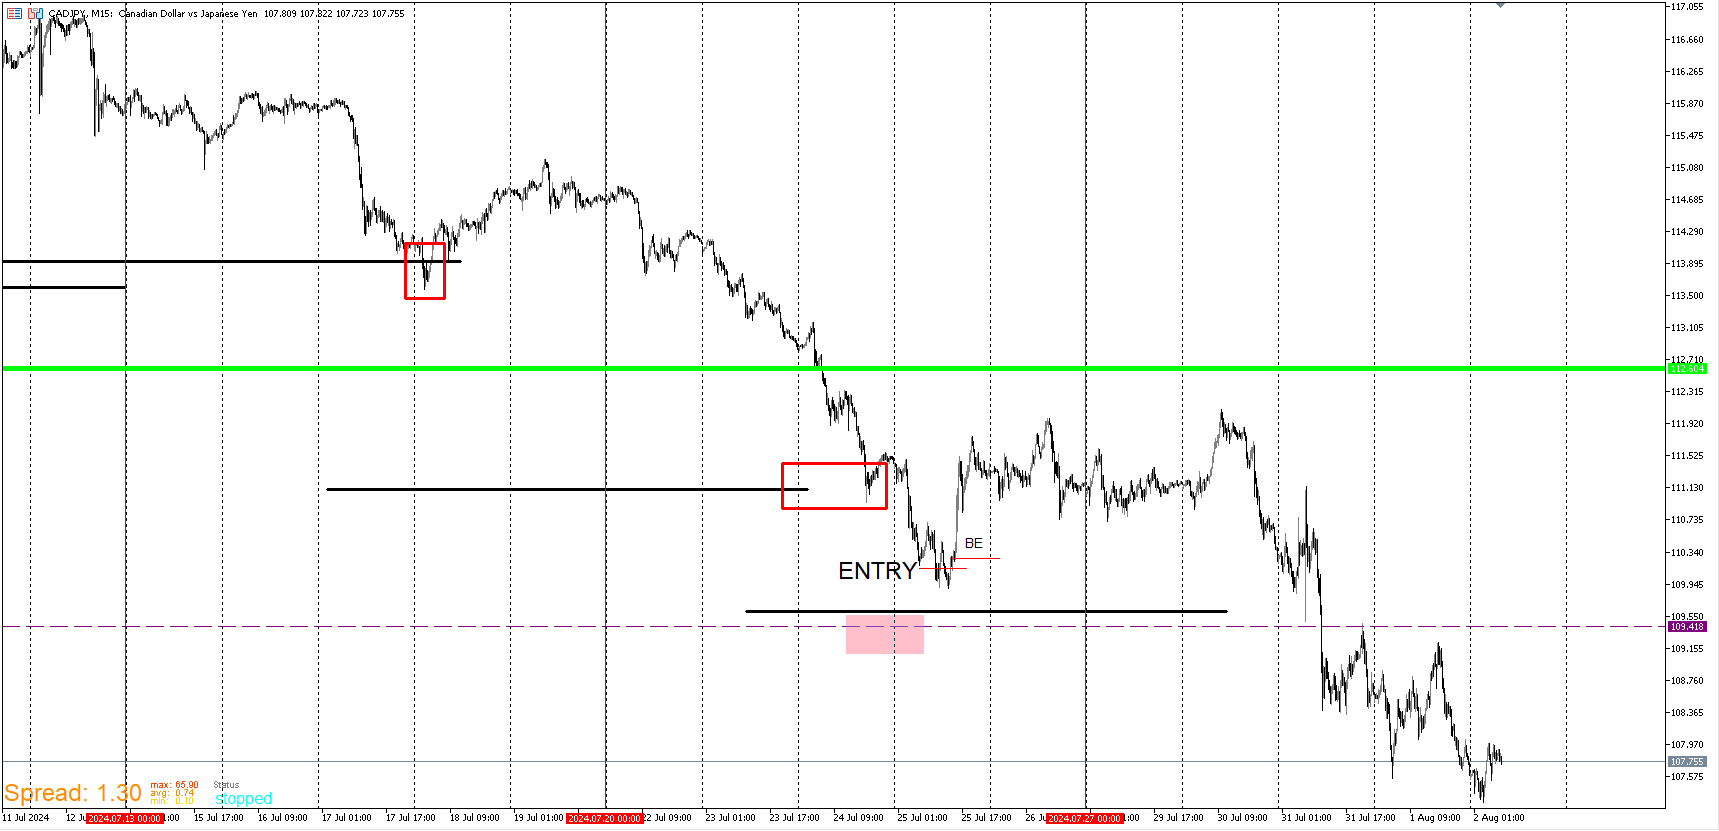
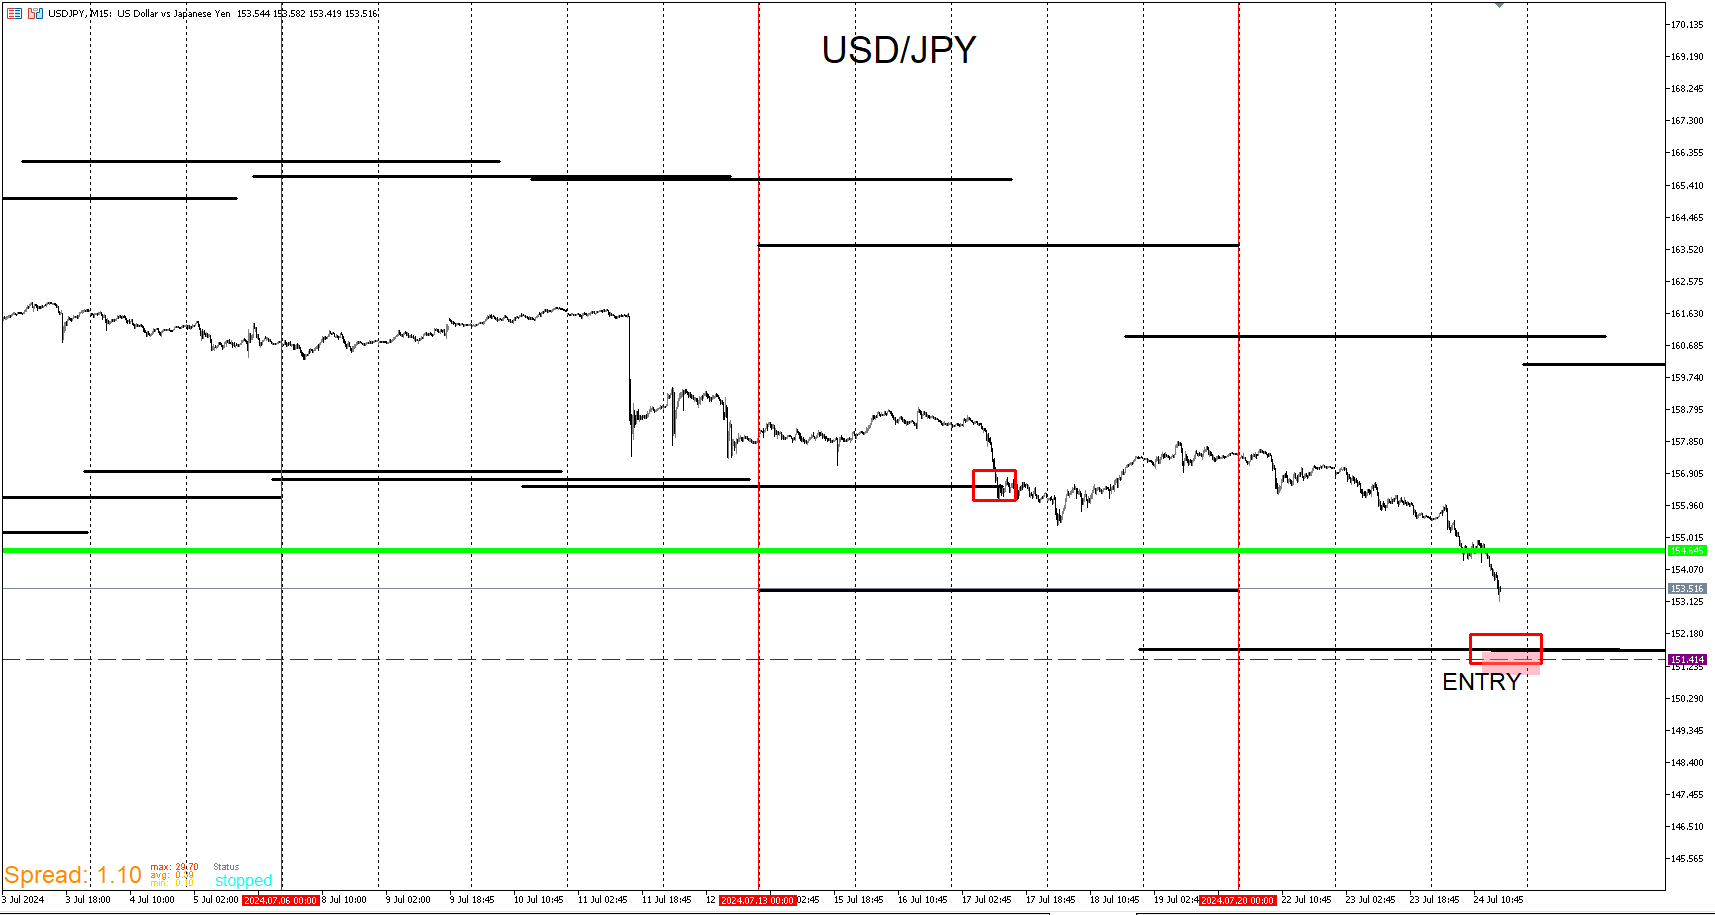
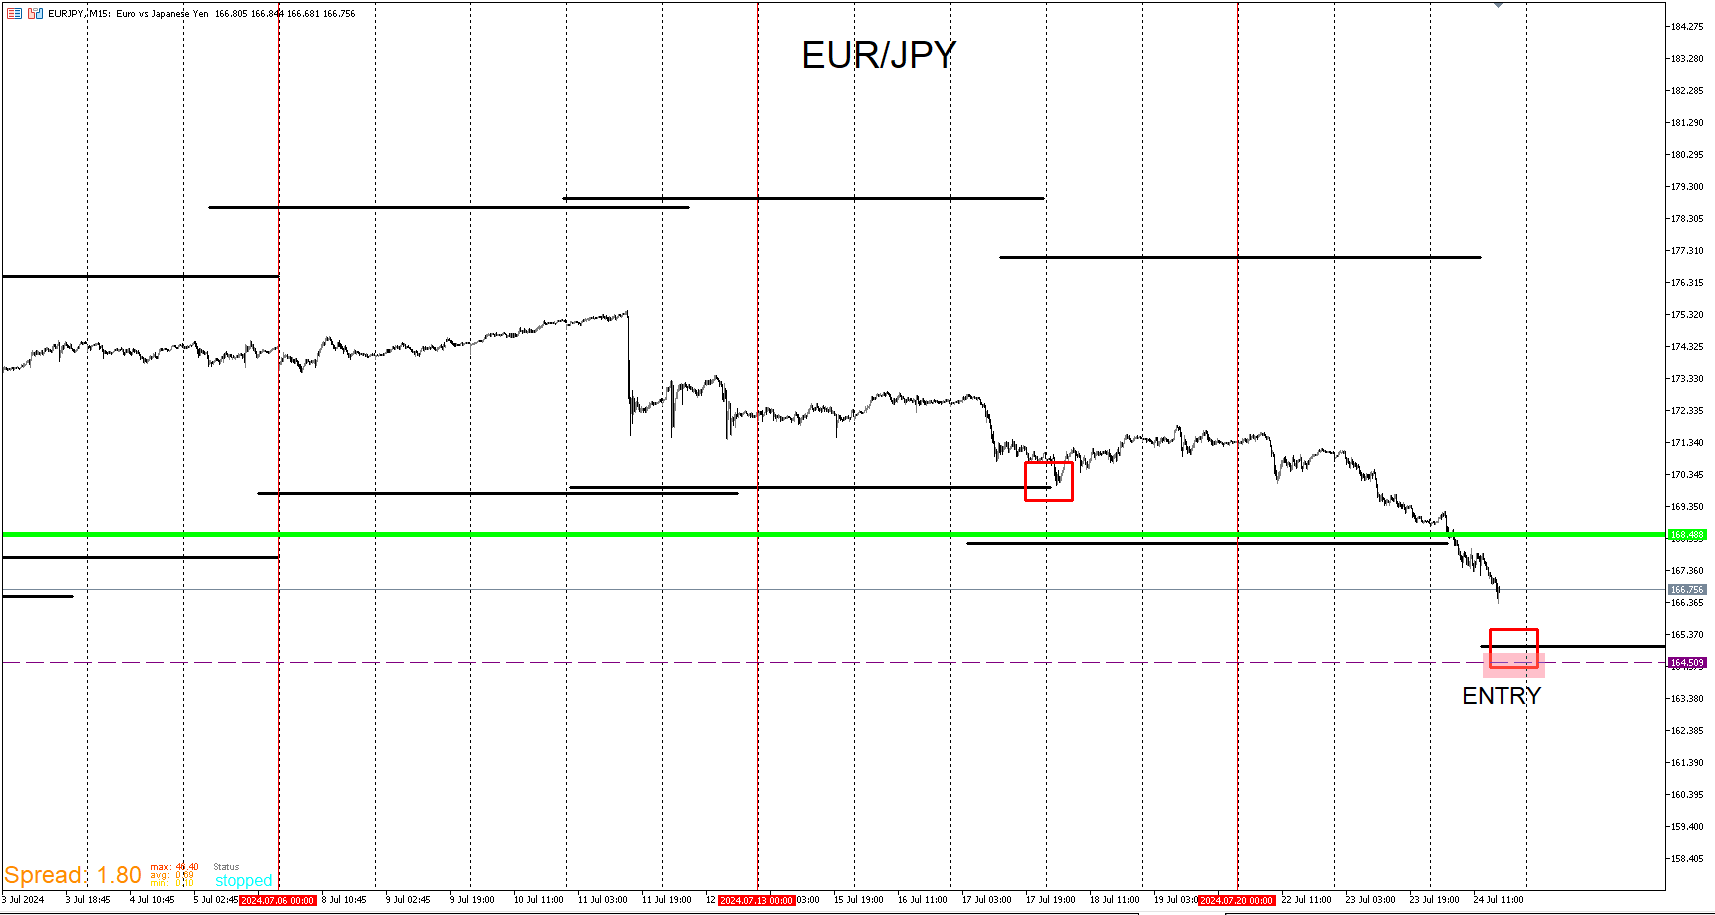
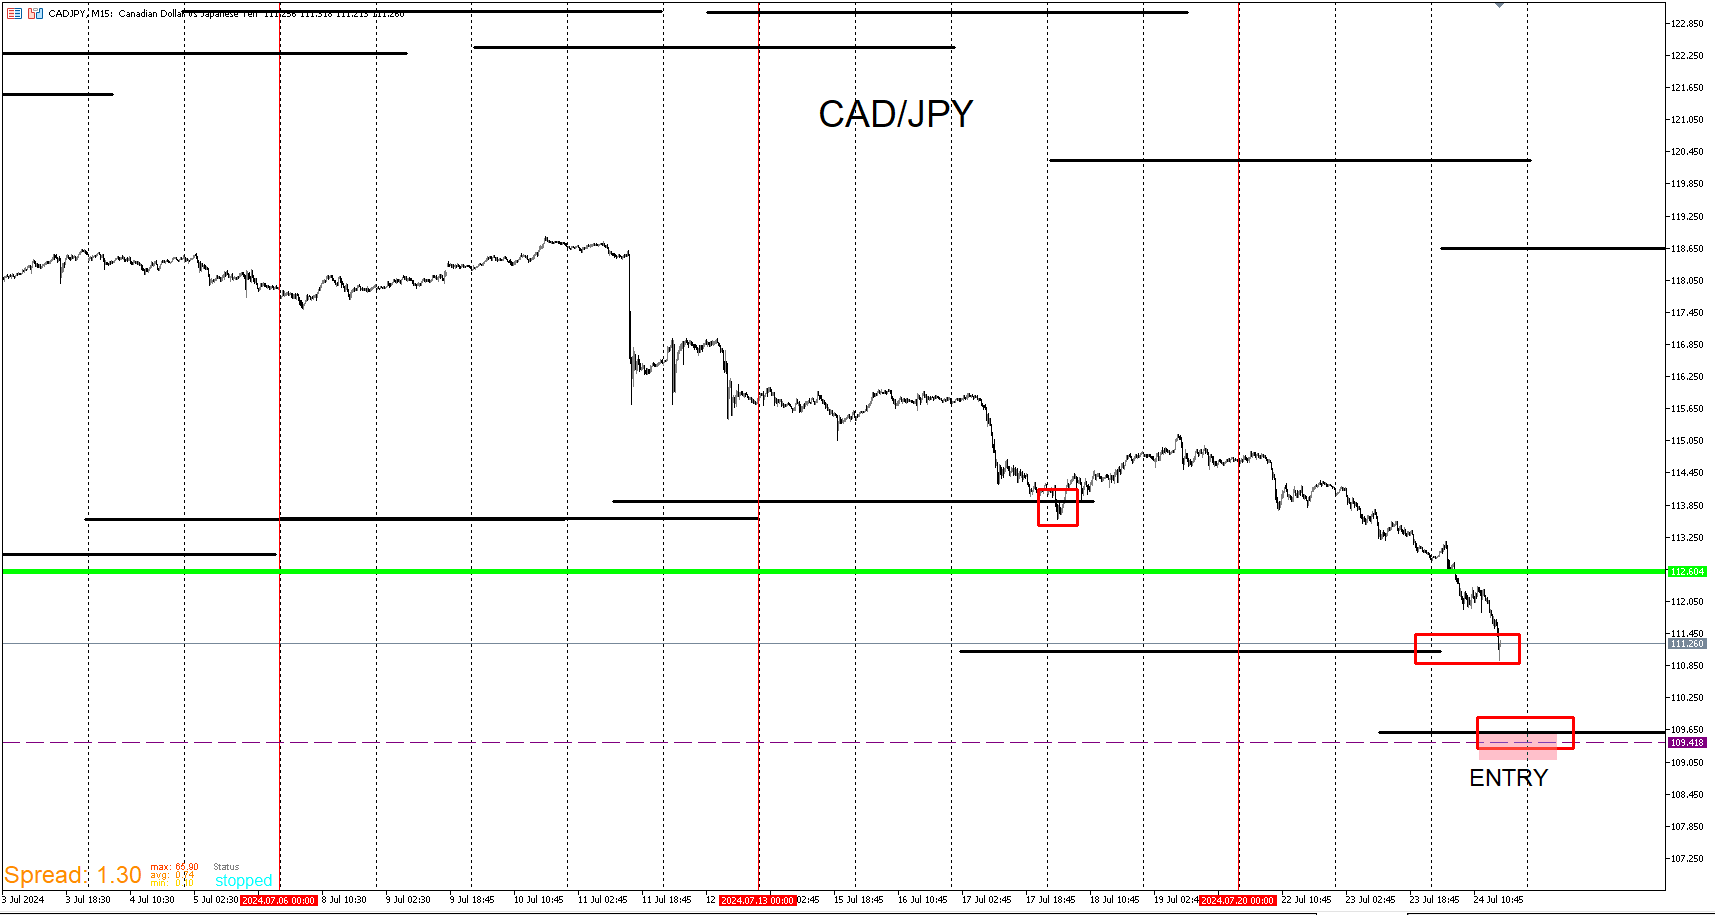
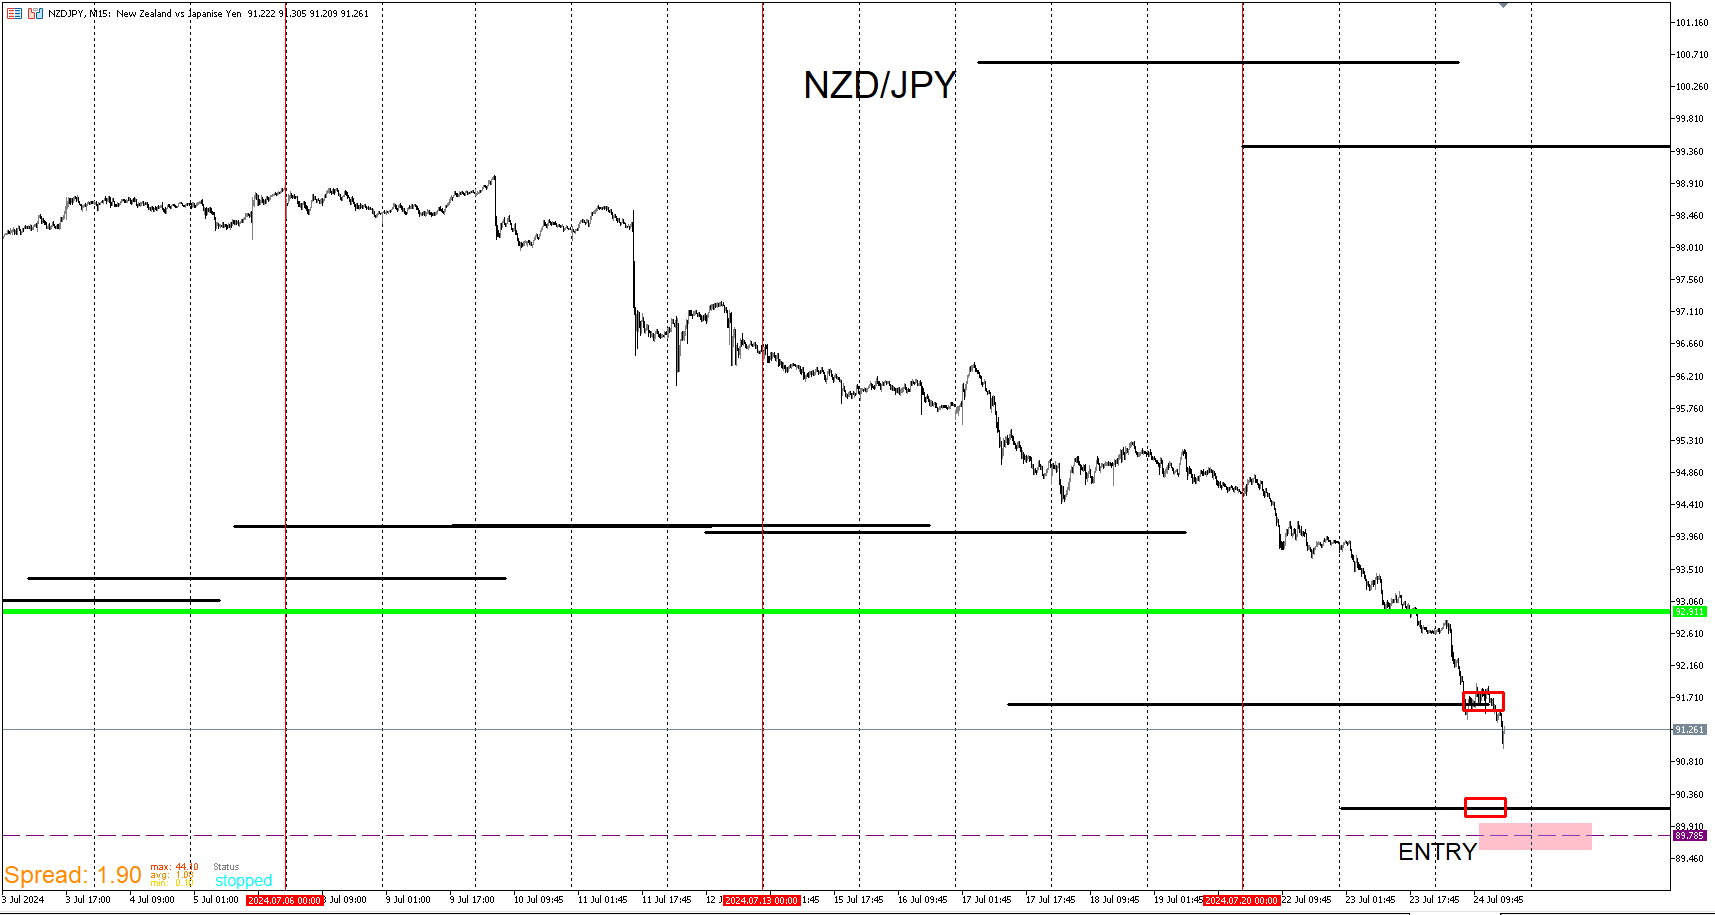
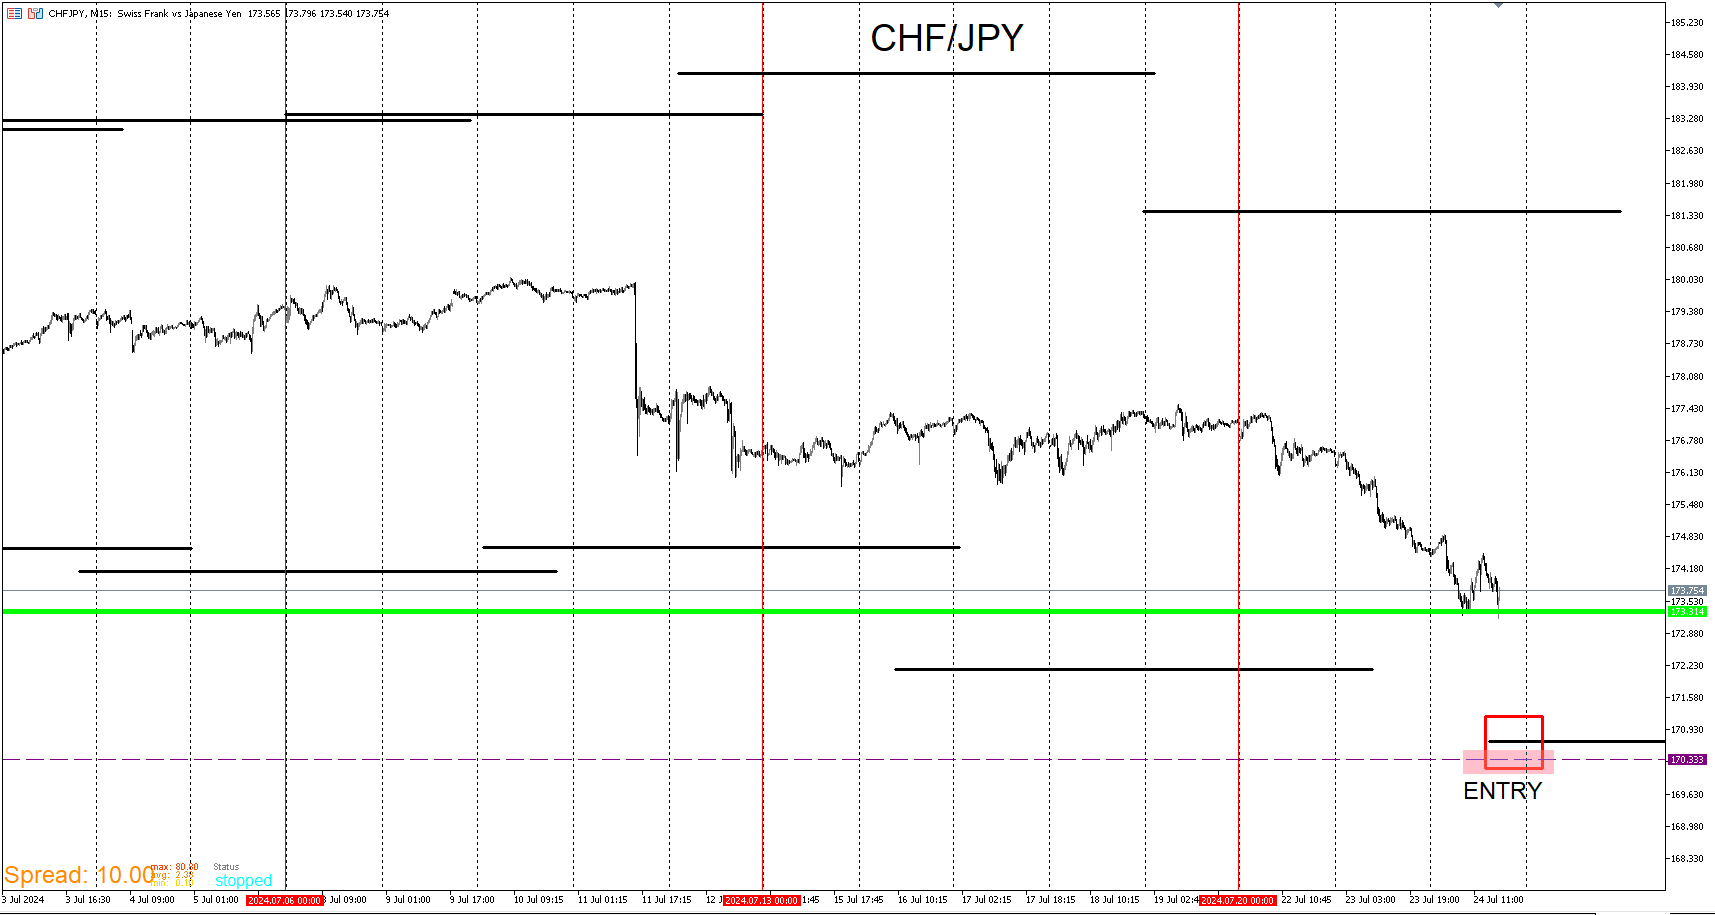
Update on the yen pairs here. Instead of entering at the original entries I posted, I entered short of it because there were buy clusters right above the wall. Price did push up and I placed my stop at break even because If I believed that price wouldn't go down any further that was a safe break even point. It held up for some time but price came back down past my levels further. So I was wrong but I didn't lose any money. When price pushes up so far and dips down to walls, I'm more hesitant which is why I didn't enter on any of the above walls. There still may be downward momentum so I will step out the way.
USD/JPY
EUR/JPY
CAD/JPY
-
RE: How to draw lines with sequential name and by quantity on the graph?posted in Questions & Answers
Are the lines a fixed number of pips away from the first line?
-
RE: Backtesting resultsposted in Questions & Answers
The 45 smooth equity curve is overrated and a longer time period makes it look smoother and the drawdown tighter vs a shorter time period. You can have a curve that turns flat from time to time and be more profitable. The way I see it is that assuming this is dead on accurate with a live account, you would have profited 1,349.00 buck in 11 years. Yeah you can scale up but it uses martingale which from what I understand doubles down on losing positions and inevitably wipes the entire account. Also as stated earlier it only takes buys which only a bullish trend yields these results. EA's need to be tested on shorter time periods so that you can understand what structure they fail on and know when to use them and when not to. The moment a sellers market kick in or price starts ranging, the EA could drastically give the opposite result. That's why most if not all EA's have periods of profitability and unprofitability because it's nearly impossible to create a strategy that fits a trending market for buying and selling as well as ranging. Then you have to account for how narrow/wide a trend or range is. That's not to say that we shouldn't create them because we should. I just believe that people are chasing their tails in the dark trying to get that equity curve over a long period of time especially when they are using one strategy that favors one market and a system that is akin closer to gambling. With that being said, I don't believe it's reasonable and don't fret over spending hours. Many of us spent many hours on projects that we canned. Some projects can take months of building and frustration.
-
RE: Support, resistance and pivot linesposted in Questions & Answers
First and foremost you need to start with that blue line. I'm assuming that everything else hinges off of it. Don't worry about the other lines now. Use a trendline like trading view has and see if your lines matches up with the trading view chart. Once you are lined up with that, then proceed to the next step.
-
RE: My EA updateposted in General Discussions
Here are Yen long setups using the wall template. If price intends on pushing up I see these entries as good entry areas.
But only if price aggressively flushes down. My interest terminal isn't loading so I'm not able get as refined as I'd like
to but I think these may be good general zones. I'll mainly be focused on USD/JPY,EUR/JPY,and GBP/JPY for the rest tend to follow those.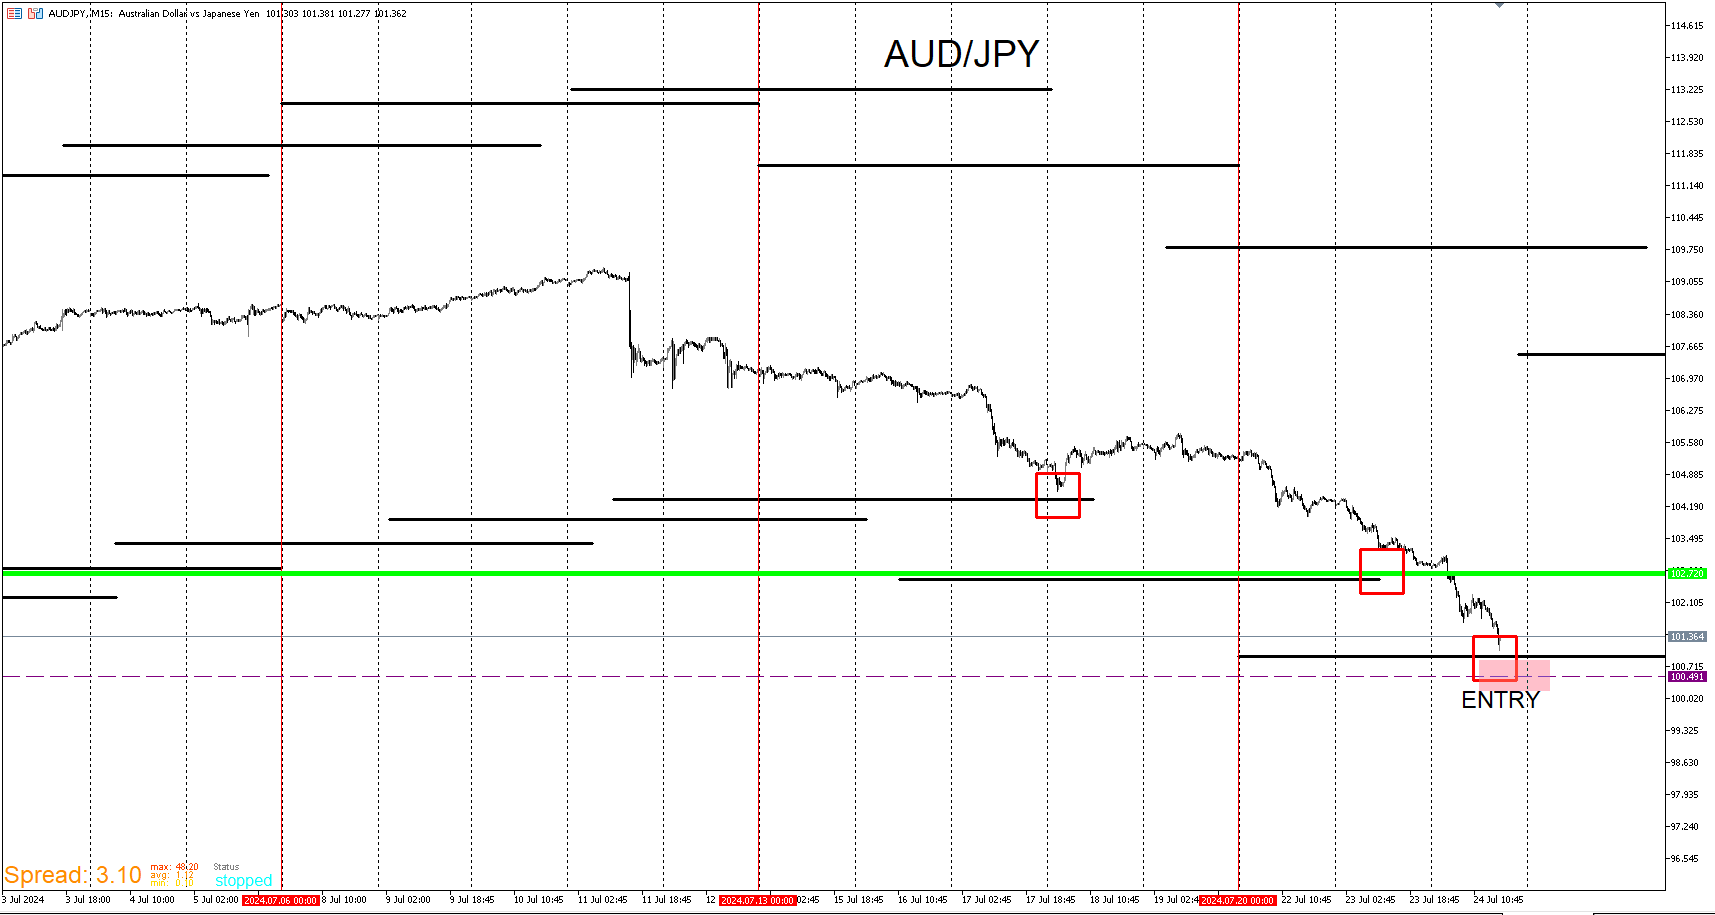
-
RE: My EA updateposted in General Discussions
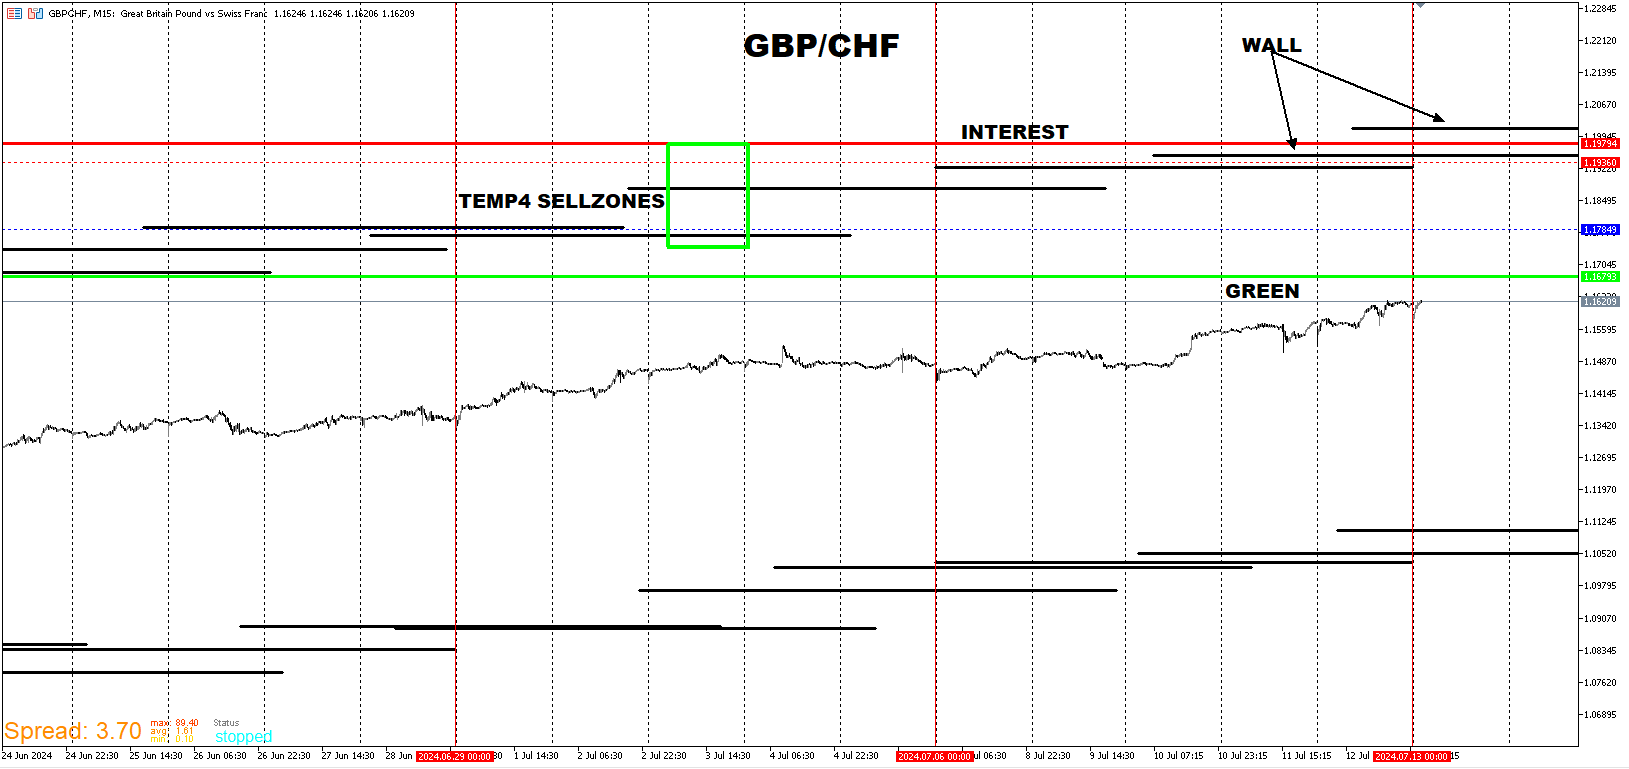
Here are the pairs I'm watching for to form tops. They are all nearing the wall template and a flush up especially pretty soon will offer a high likelihood for reversals. I was short on GBP/CAD for the past two weeks but I'm fine with it pushing up to a more probable area.
-
RE: confused with drawing lineposted in Questions & Answers
@DragonZueloTrends It could but the problem comes in at defining the structure. I haven't experimented with it enough to fit it to structure. Even if it could be, I'm not even sure if it would be all that useful because structure breaks in on itself doesn't mean anything.
-
RE: My EA updateposted in General Discussions
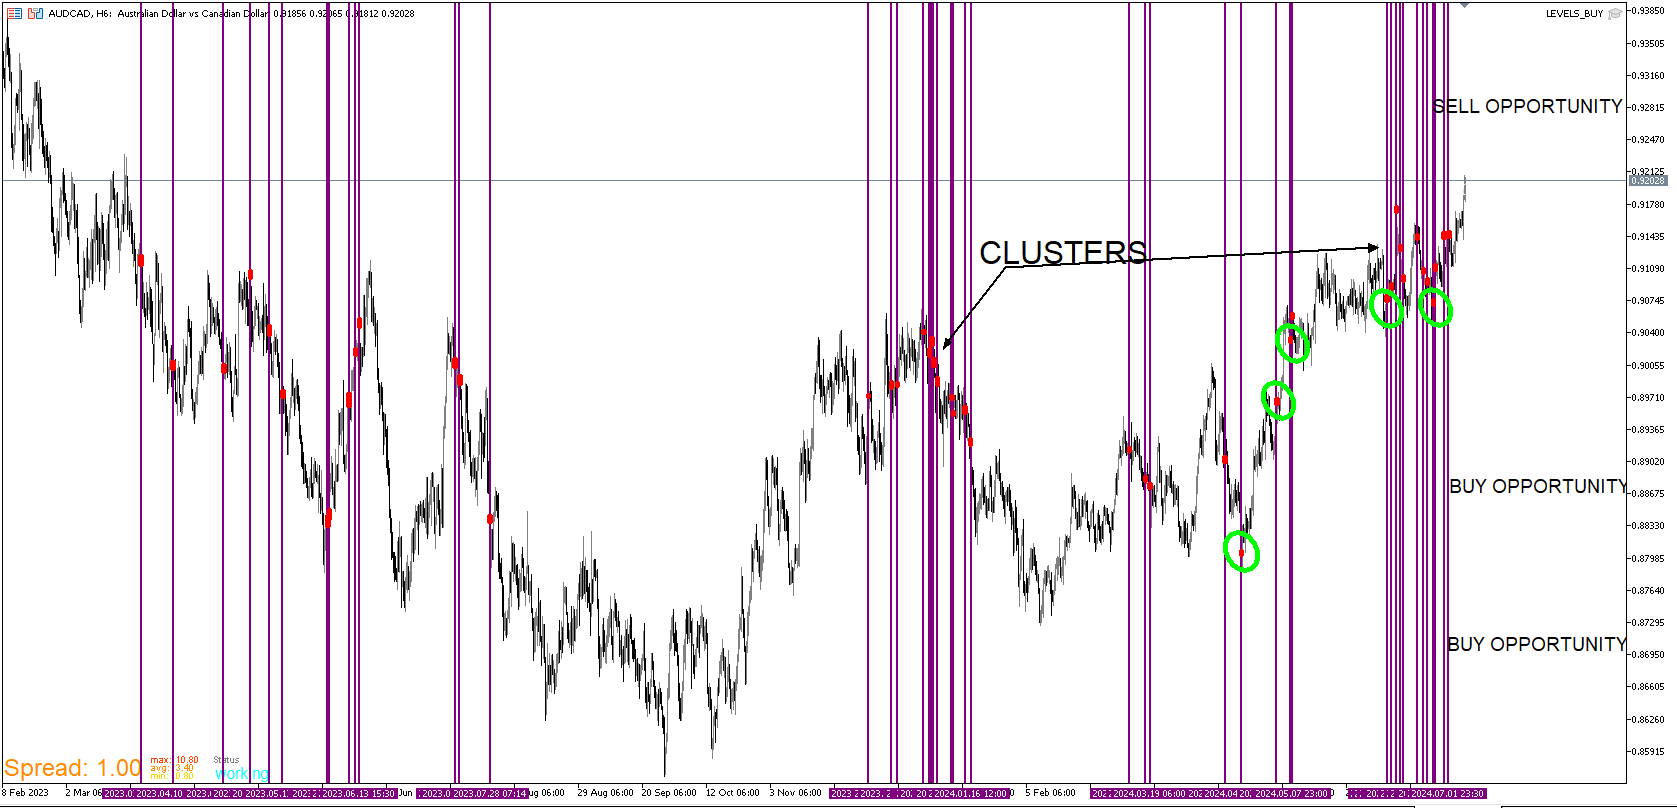
Here I will go more in depth on the correlation aspect of the B/C/C Template. I have observed many examples to support this and I have taken some trades specifically the CHF pairs based on this template and will post updates on them later. I believe that now is a good time to show a live example of this strategy. The basic idea of this is that when price pushes off from these zones, I need to see what a negative correlating pair does. Ideally one that is heavily negatively correlated. A rule of thumb is that the opposite pair usually does the opposite. That doesn't mean that I enter in the opposite direction on the negative pair. Sometimes it can go in the same direction before reversing. Sometimes it reverses as soon as the opposite pair trends the opposite direction. If it doesn't do the opposite at all, it at best consolidates for a while. There are rare cases when it trends in the same direction as the opposite pair. That's the information I look for. I will use CAD/JPY and AUD/CAD in this example.
I first start off by marking the push off zones with a vertical line. What this does is that it provides the exact point in time when the push originated.
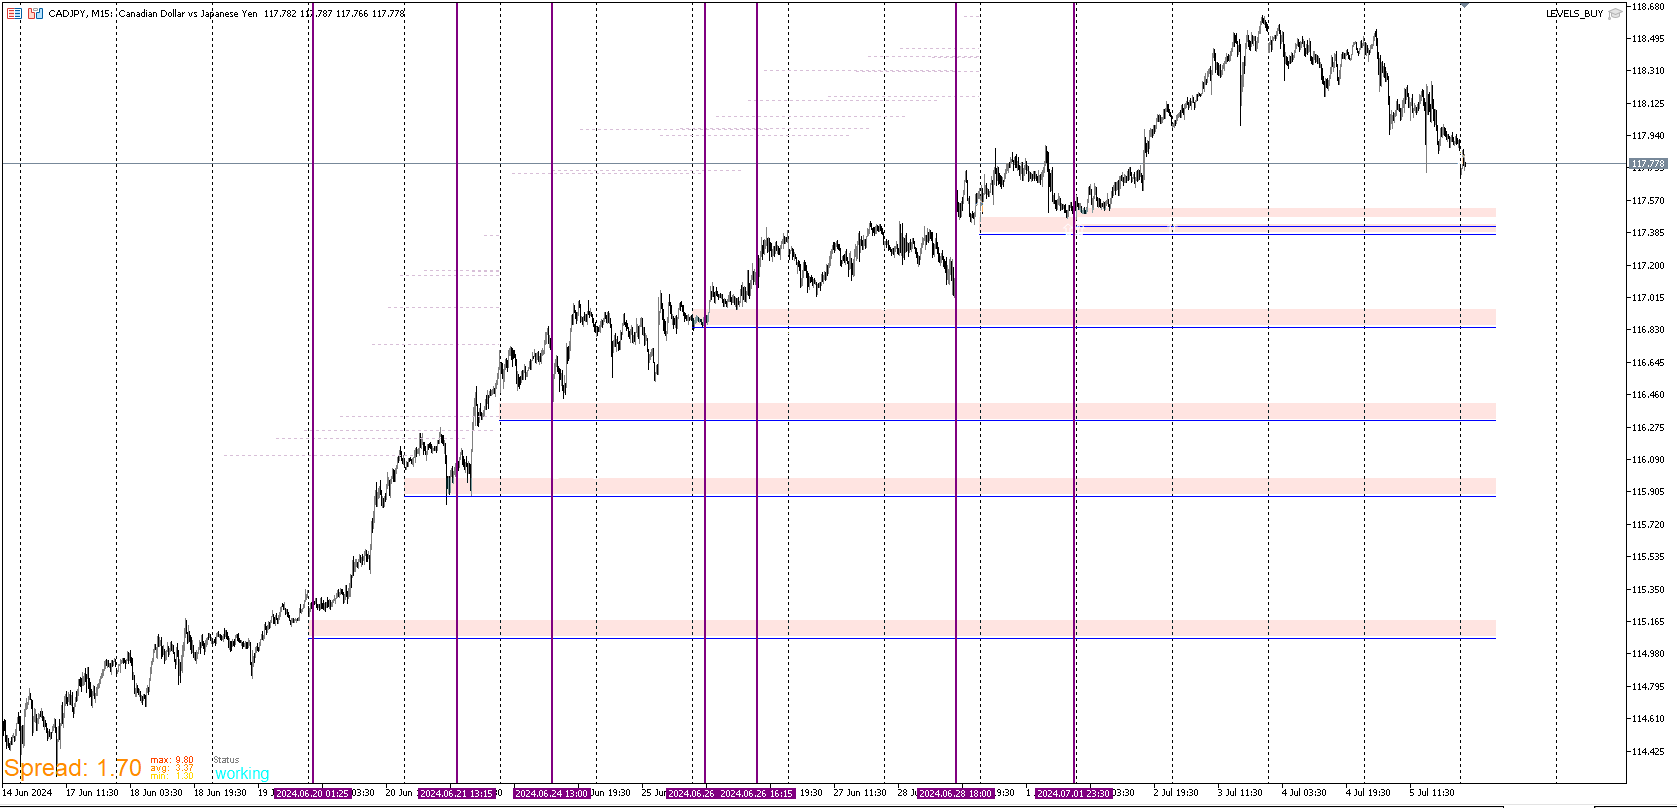
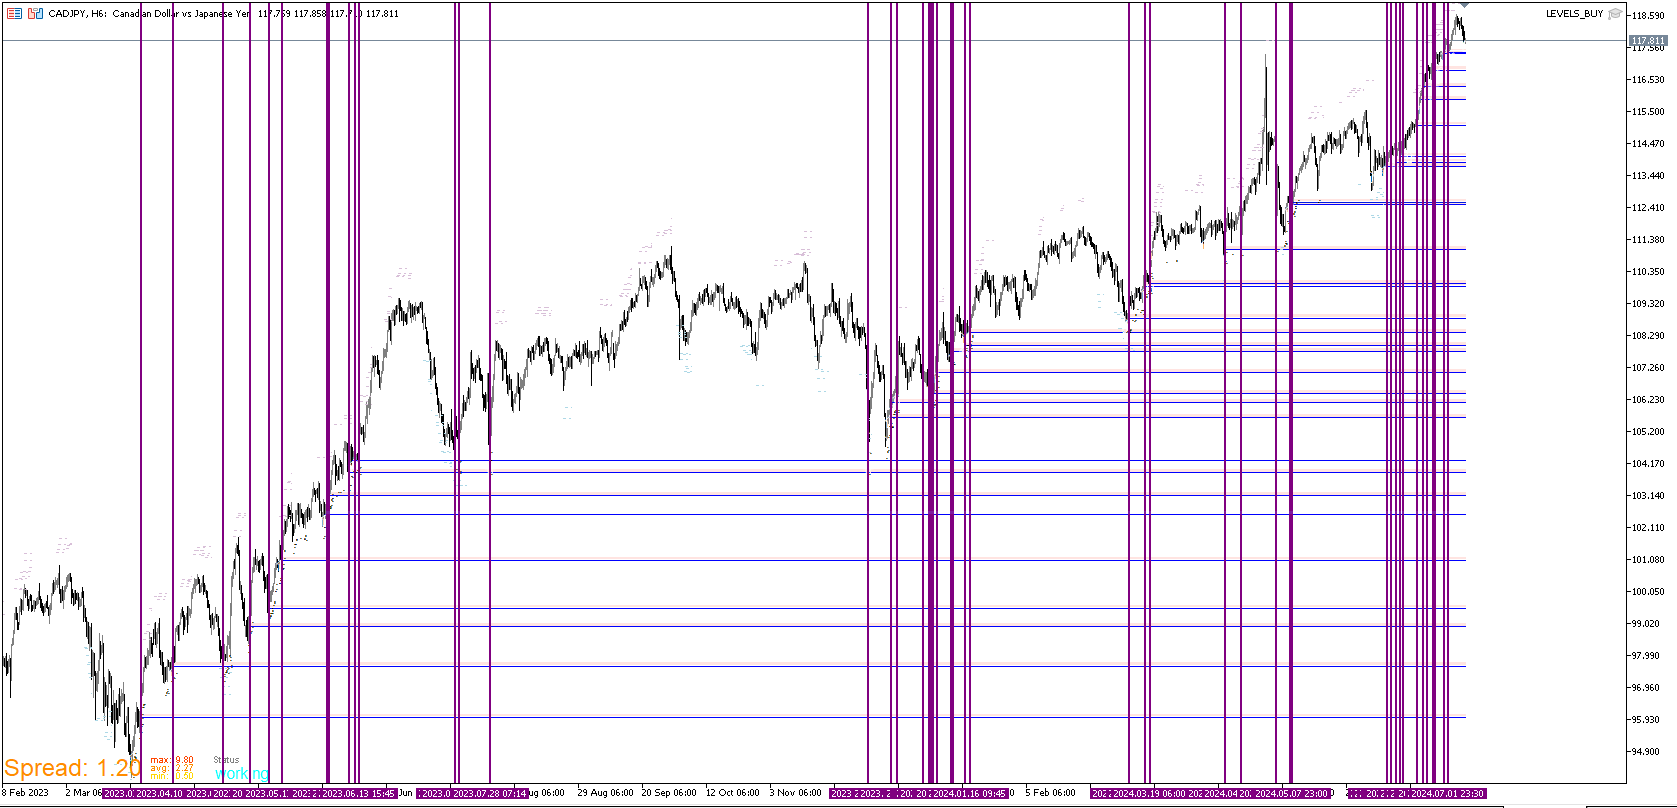
The next step is to save the template and apply it to the negative correlating pair. In this case CAD/JPY has been trending up. I will apply this template to AUD/CAD. Since the vertical lines represent time, I can see what AUD/CAD did the moment CAD/JPY pushed off. I highlight that time as accurately as possible with a rectangle.
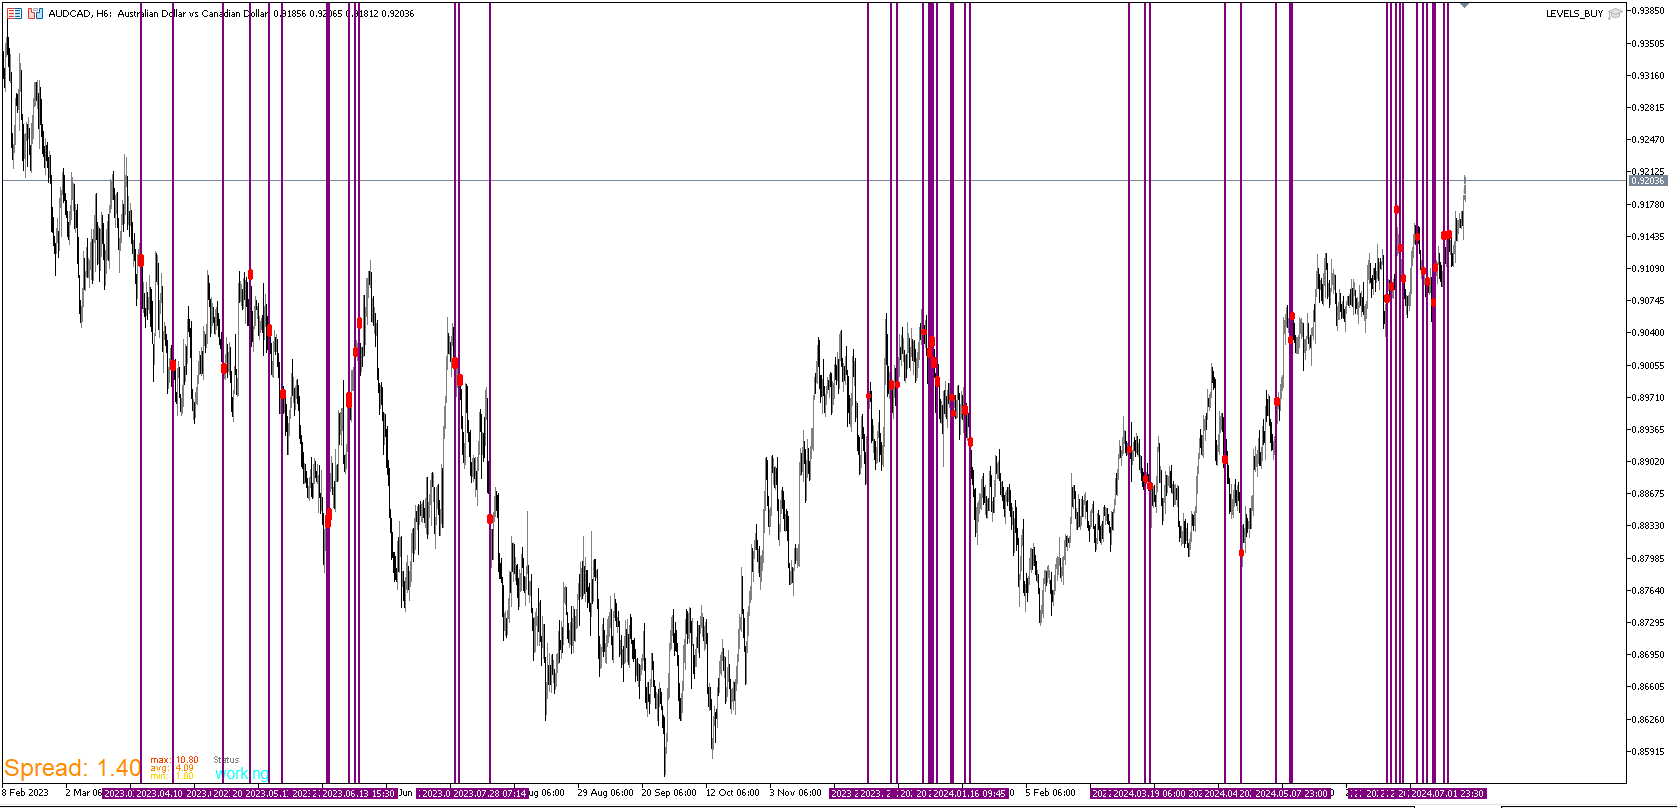
On the negative pair, I look for where price moved in correlation with the opposite. In this case, There are points when AUD/CAD pushed up at or around the same time as CAD/JPY. Those points are circled in green. Instead of buying as price continues up, I don't deem this upward movement as sustainable. Below those points are much better opportunities and I mean below as a couple hundred to few hundred pips. If price goes 50 to 100 pips below, that's not good enough. I believe that AUD/CAD does intend to go up but before it does, I need to see price come down below the green circled levels. Also where ever there are clusters, it's a very low likelihood that price will continue to push up. In this case I am short AUD/CAD but only if I'm getting other signals that prove to hold up over time. I'm not entering blindly.
-
RE: Hello how can I create an EA that, on the M1 timeline, draws a square showing the H1 candles?posted in Questions & Answers
@DragonZueloTrends I can't contribute anything as far as the strategy itself but I can provide a project example of the 1 minute candles within the 1hr candle. It's not perfect and there are probably better ways of doing it but this is how I would go about it. I definitely agree that everything should be broken down first and I will add that it's best to create the conditions and have them draw arrows as confirmation/entries and if it work, then switch it out with orders.
I normally don't provide files but I will here because it would take more time explaining. I'd advise to review it and do it from scratch so that you'll have an idea on getting a similar project started.
-
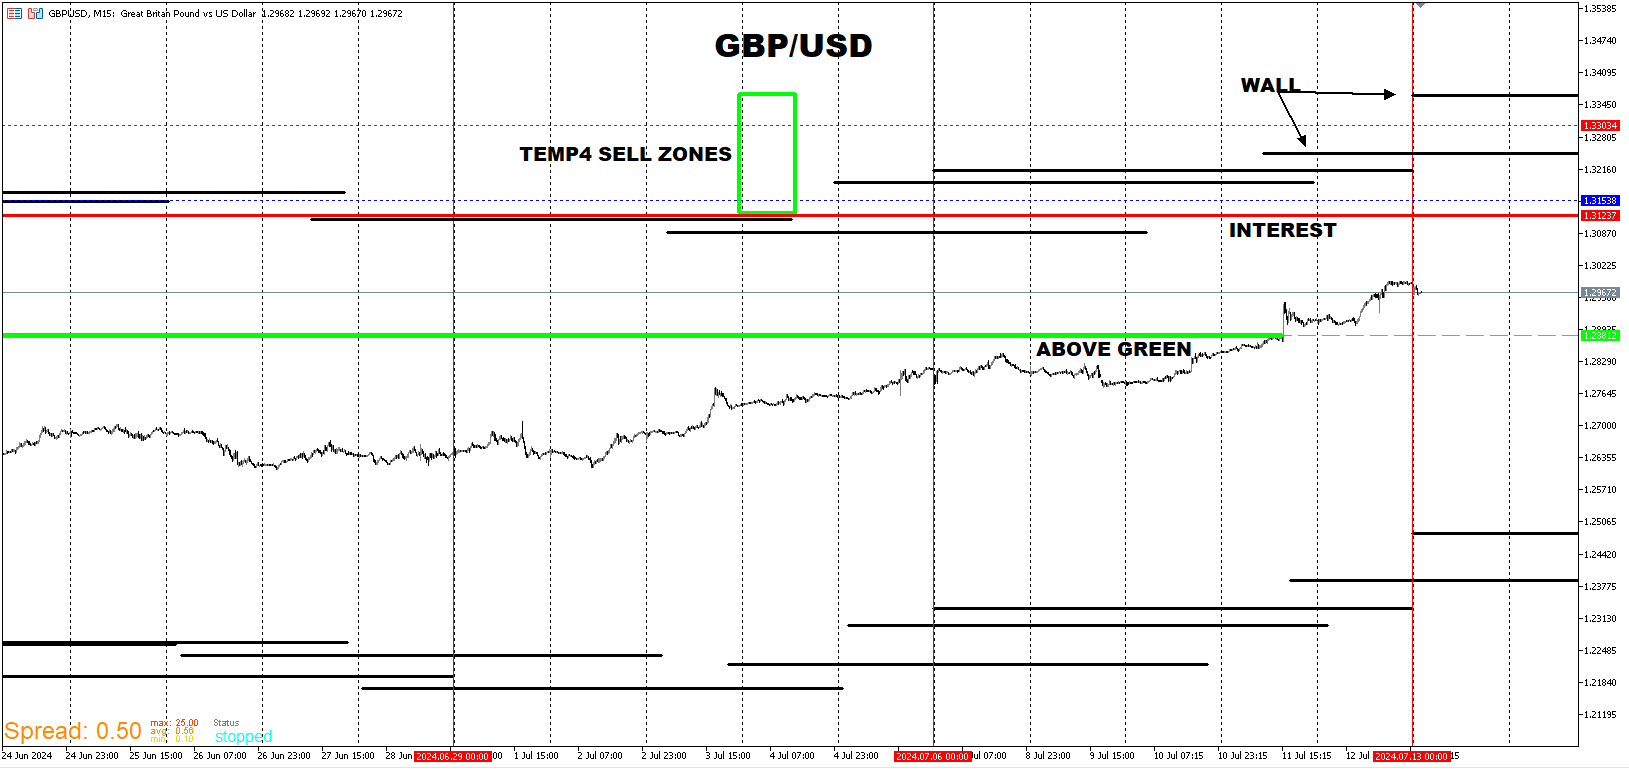
RE: My EA updateposted in General Discussions
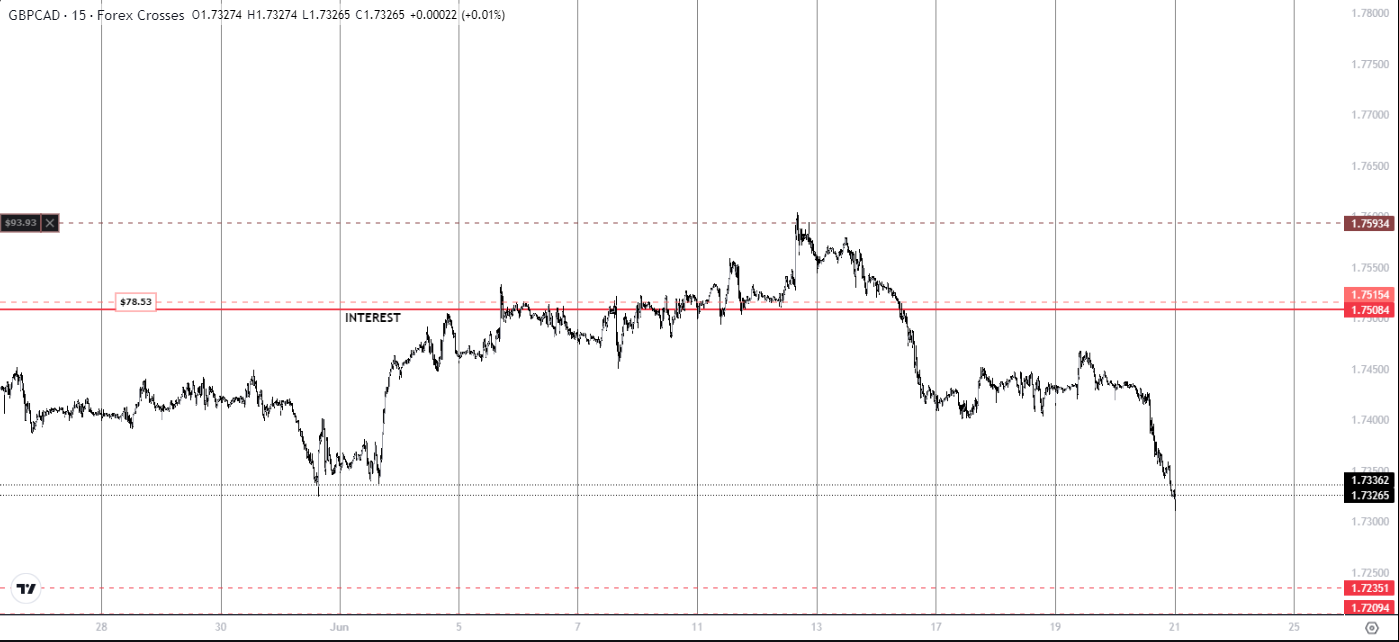
GBP/CAD UPDATE
I'll take a sell when price comes back to the interest level.
-
RE: My EA updateposted in General Discussions
My templates are signaling a potential reversal for the Yen pairs. I don't have time to post the charts right now because I have to go to work. But I will post the levels where I'm entering at and follow up with the charts later. This applies if these levels are hit really soon. This is for documentation purposes.
USD/JPY: 162.949
EUR/JPY: 173.289
GBP/JPY: 205.331
CAD/JPY: 119.370
NZD/JPY: 100.466
AUD/JPY: 107.871
CHF/JPY: 182.172 -
RE: How to limit the TOTAL number of multi-currency trades?posted in Questions & Answers
Have you tried the check positions count node? I'm not sure exactly how to set it up off the top but I'm sure it doesn't take much work.
-
RE: My EA updateposted in General Discussions
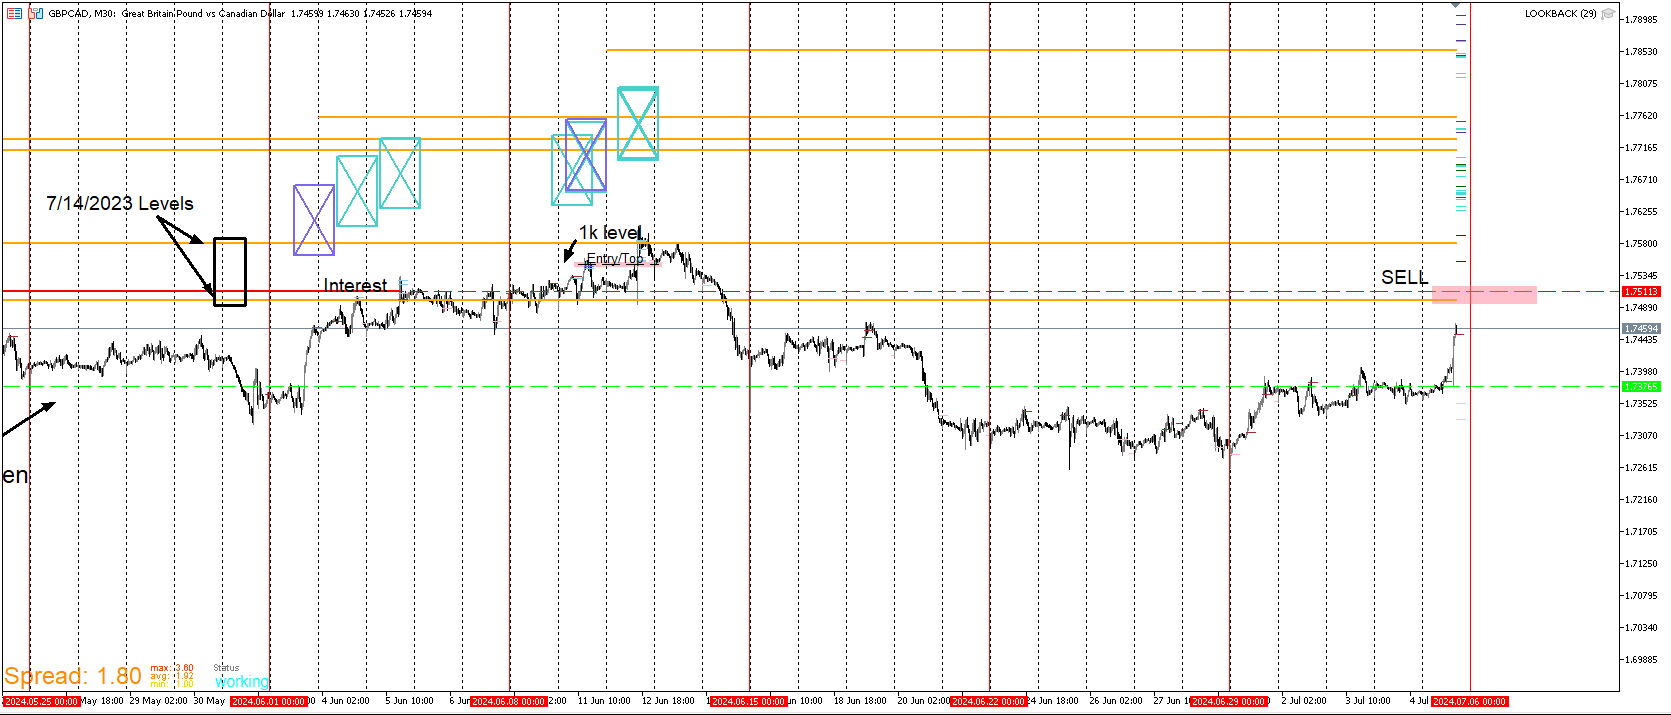
GBP/CAD UPDATE
Here's an update for GBP/CAD
Price did reach the level that I believed at the time to be the top. But soon after there was a major spike up. I noticed that this spike happened in just about every pair major and minor pair. Some were to the downside. This one just so happened to be one that went against my entry but I wasn't concerned. A general rule with a template like this is that I don't want to go long at these levels because there tends to be a solid likelihood of buyers getting crushed when late buyer excitement merges with what I believe to be sellers desperate to close their positions. Every template is designed with this concept in mind. I actually added a position around the top of that spike because I just couldn't see the market rewarding buyers on that spike. What I have learned in this situation is that price movement isn't always isolated to a single pair. It was likely a fundamental thing which I don't pay attention to and even then, the drawdown wasn't bad compared to how far price reversed.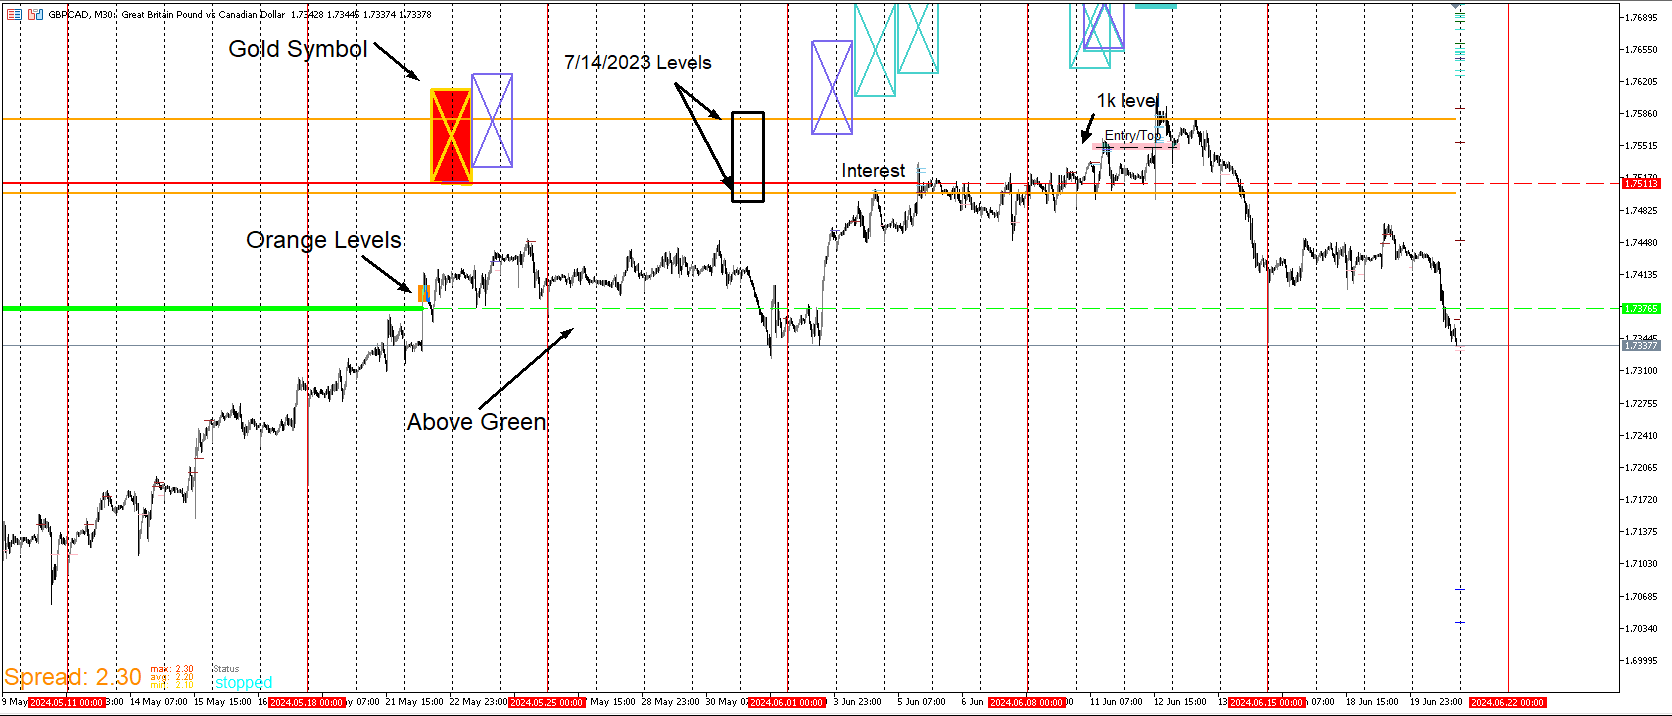
I post my entries just to show that I do actually place these trades with live money.