@drayzen said in % profit for all trades...:
3 / 100
just replace the "3 / 100" with your constant, type it there.
AccountBalance() * yourconstant
@drayzen said in % profit for all trades...:
3 / 100
just replace the "3 / 100" with your constant, type it there.
AccountBalance() * yourconstant
Custom indicators are usually hard to troubleshoot...
I'd suggest start from the custom condition -> if true, draw vertical line. Then check the visual tester and see where it draws the lines.
"inp10_..." refers to block #10 - you dont even have block #10, so thats strange indeed.
I am not sure about that TestGenerator error, it seems to be warning about your trade size (as you trade every candle and never close)
If you have the project in the web builder, just open a new tab with a new project, and copy-paste the blocks.
Importing .mq4 or .mq5 also works, but
The "once per bar" works only at the beginning of each bar, so the price is essentially the open price. That's why its not very beneficial to check both open and close prices at the first tick, because they are the same.
I would use this logic:
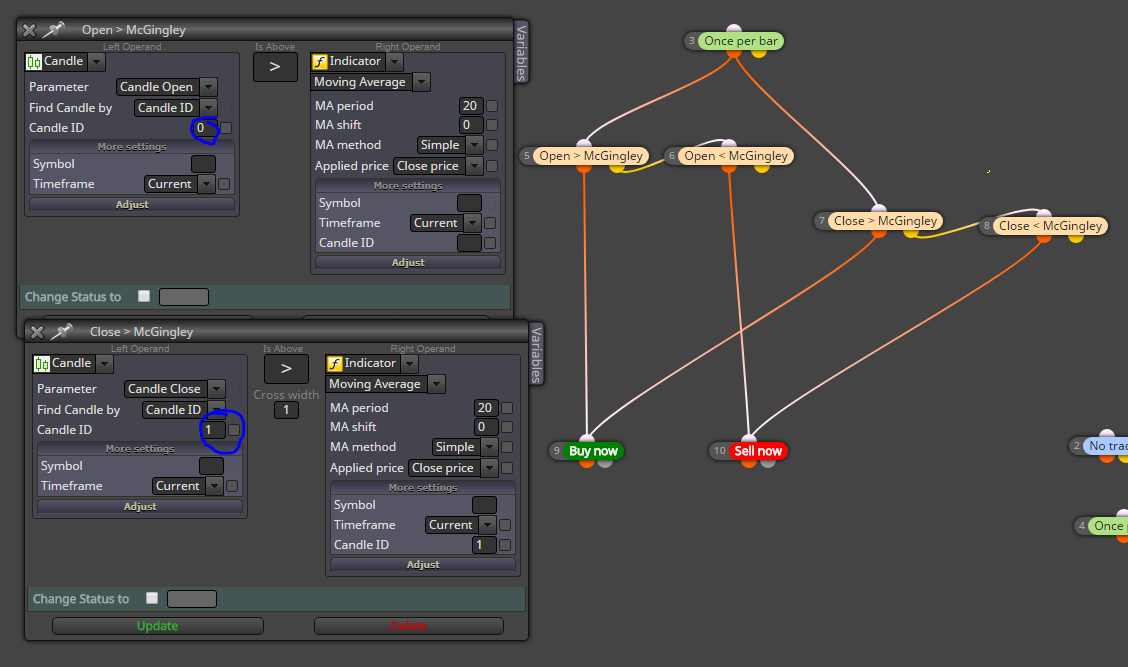
In English: once per bar we check the current candle open (current candle = id 0) and compare it to the indicator (blocks 5 and 6).
If that condition is true -> open trade
Then check close price, and not current candle close but LAST candle close (id 1) (blocks 7 & ")
Note that this is somewhat silly logic because 2 of the 4 conditions must always be true - the bot trades 2 times every bar!
I played with objects today, and made some EA using regression channels.
Its a huge mess. But there is something I like about this monster.
Its not optimized in any way, but I thought why not share this, maybe it inspires someone.
The project is so huge the browser builder doesn't seem to load it, so here's the .mq5 (compile it in your metaeditor)
This works (least horribly) on EURUSD, M30. You can use open price -only testing, I designed that way.
0_1524336136732_LINEAR2.mq5
0_1524347440090_LINEAR2.1.mq5
Part 2: Here's a simple project that "remembers" recent highs and lows, using slow macd. Next I'm going to implement the regression channel to this
https://fxdreema.com/shared/BhZLMirre
I agree with yalgaar. Radoslav you have built an amazing tool which sets no limits to my work. And what is even more admirable, you tirelessly continue to support and help the users through the years!
Thank you fxDreema.
A while ago I decided to stay away from drawing objects, but here I am again.
My project will have several timeframes, e.g Weekly, H4, M30.
I want my expert to draw an object to Weekly, but all the other work is done on faster timeframes - how can I set the correct chart for the drawing?
Edit: This seems to be a deep, deep rabbit hole I am getting into. I managed to find the chart ID:s, but the MT5 strategy tester draws its own chart ID:s - so I couldn't visual test my bot even if I knew the chart ID:s. I guess its better to draw the objects to a single chart and just scale them properly.
Yeah, I agree that is not very useful a feature - hope we could turn it off.
If you hover your mouse on the variable field and roll the scroll wheel, it puts numbers there - maybe thats the issue?
Do you mean the tester doesn't work at all, or the other pairs make losses?
Maybe its a history data problem?
Is it mt4 or mt5?
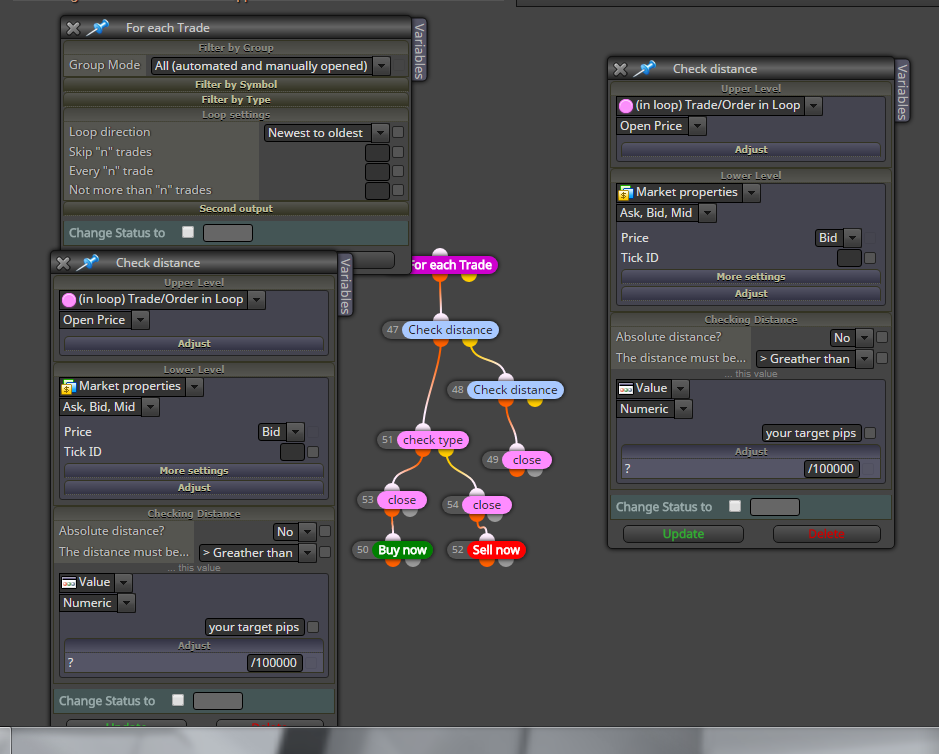
Maybe something like this works... Try measuring the profit and loss with the Check distance block. So you will need two blocks of those, both in a loop that goes through all trades.
@xolasoqashe said in How Do I Save:
.."
It downloads the file to your default download folder - check your browser settings
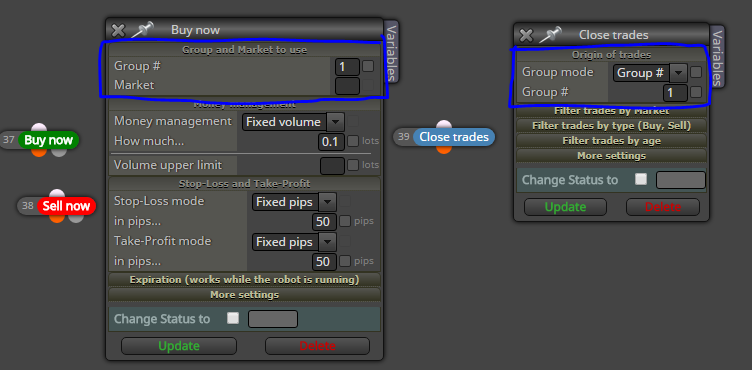
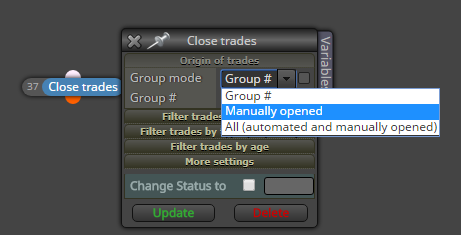
You will want to use group numbers (#) for differentiating between the "parent" and "secondary" orders. Then use logic like "parent trade is running -> keep x amount of secondary orders in place -> if there is more than x amount orders, close the oldest and repeat loop (see picture)"
hope this helps some

Run Blocks works similarly than those drag-and-drop connections; if you have vertically connected blocks, say id1 -> id2 -> id3, just type id1 in the Run Blocks. The flow will then continue to the normally connected blocks below.
I'm afraid there is no elegant solution to finding median.
For measuring volatility, my way is to compare a fast volatility to slow volatility, for example a formula block with 21-period standard deviation divided by 144-period average true range. This gives a ratio of around 0.5 - 3 and that is enough momentum info for my projects.