@trades07
I never used this market propriety parameter but, from what I get the pivot point uses in its formula the Close of the candle. However the candle you designed has no ID (= ID 0), and the candle 0 (actual one) isn't closed yet. So no close value. Try to write an ID number of 1 at least.
S
Posts made by seb 0
-
RE: help!!!posted in Questions & Answers
-
RE: EA dumpposted in Tutorials by Users
@roar
It actually is more difficult to simulate than I thought. Cause in case of a prolonged down trend, the consecutive sell signals will make increase by much this no-stops short position, I guess that's why the lots sensitivity is needed ?
On a 3 years sample the results of my strat looks good but its probably not significant enough.
I am currently switching to FXTM, so i will be able to test the EA on a larger sample, and with this more relevant netting method. If the results are still good I will tell you")
-
RE: EA dumpposted in Tutorials by Users
Dang i missed this topic!
That actually is really cool, i didn't get the netting method right, i thought it was the fact to accumulate the trades of a same type... Now it opens up many perspectives to me. If I don't have a netting account I still can simulate it with a simple close trades(sells when buy signal) block right ?
Your strategy looks pretty simple and effective. On a higher timeframe wouldn't the PriceMouvement/Spread ratio still give better results ?
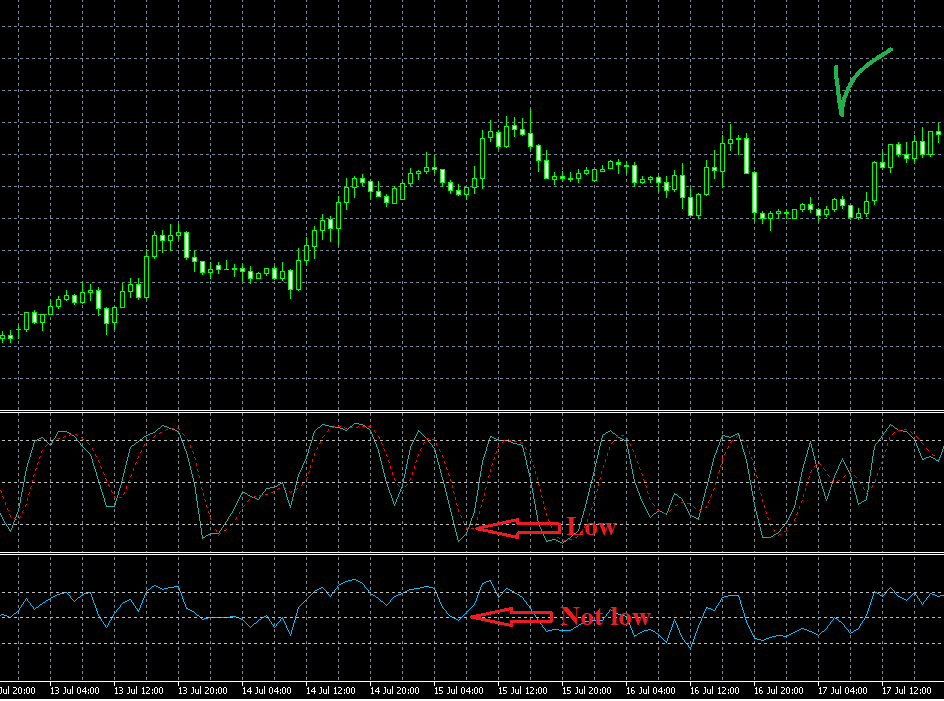
Talking about that i just found a simple configuration that also seems to give good results. Here is what it is :The excessive value of the stochastic oscillator occurs when a price movement is significant compared to the recent range so
in a up trend ::::::
-the downward oscillation will not be overpassed by much by the recent range as soon as this trend is not too aggressive so the Stocha will be low. (fig 1)
-In this same situation the RSI will not go down by much because we are in a uptrend so the downward oscillations are hampered by the fact that we are in an up trend. (fig 1)
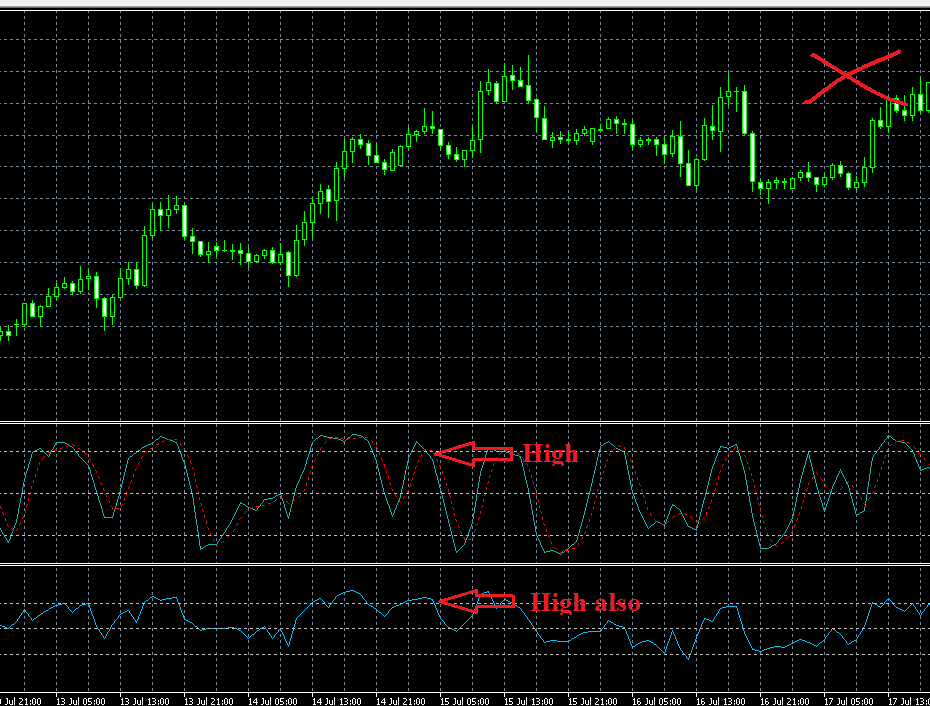
In a up trend :::::::
-the upward oscillations will make the Stocha oscillate as much(as the downward oscillations) (fig 2)
-however the upward RSI oscillations are gonna be amplified by the fact that we are in an up trend (fig 2)
Conclusion(mine) : The good signals should occur when the value of the Stocha is excessive, but not the one of the RSI.
The periods of the indicators need to be adjusted, and I added an minimum ATR value so the little price movements during flat market are not taken as signals.
The good thing about the strategy is that the trend taken in count by the indicators divergence, is a really recent one, so the lag is really low.
https://fxdreema.com/shared/cYklE3lHc -
RE: Please help Test Expert Advisor.posted in Questions & Answers
What a beautiful downtrend
Maybe you should try to extend the stops -
RE: Please help Test Expert Advisor.posted in Questions & Answers
@roar
Indeed it looks far to be excellent. Since it probably is slightly above 50% chance of winning I'm gonna invest some money I can loose while improving my strategy
Thanks for showing me i had a too narrow view of the picture! -
RE: Please help Test Expert Advisor.posted in Questions & Answers
@roar
I agree, but it's the maximum I can do on this time frame with this strategy and 3 years is the maximum period for a 99% modeling quality, maybe im gona switch of broker.
Ok i didn't do it because i thought these parameters should be part of the fixed ones.. -
RE: Please help Test Expert Advisor.posted in Questions & Answers
@roar
Alright this reassures me a bit : ) , here is my EA https://fxdreema.com/shared/OKVi1ScGd
The 6 inputs to optimize are the 2 TPs; 2 SLs and 2 MAs ... in the constants, did it on GBPUSD; H1; 10/10/2017 - today. -
RE: Please help Test Expert Advisor.posted in Questions & Answers
@roar
You were saying about optimization that : The "forward results scatter" should have a rising pattern, similar to the "optimization results scatter" so it would mean that the EA survives well on new data.
I managed to have some good optimization results with my last EA using the Forward result that had the best compromise result between Back-test and Forward-test. However I don't manage to get this rising pattern on that "forward results scatter".
Would you mind if i send you my EA so, by using your methodology you can tell me if you find a good "resilience" also or it inst worth it? -
RE: Please help Test Expert Advisor.posted in Questions & Answers
@tsheppo
Hi, can you paste the fxdreema shared link of your project please -
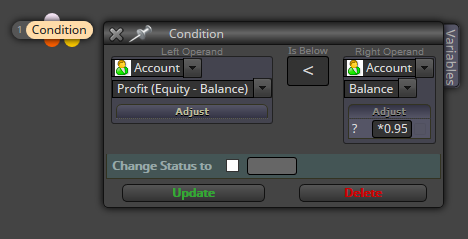
RE: balance limit to open operationsposted in Questions & Answers
@ajmd97fx
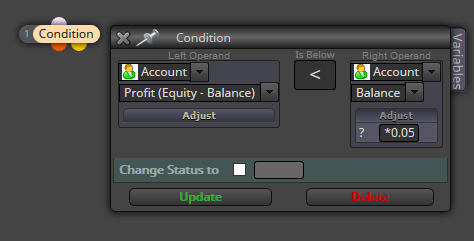
This is in the case of a (positive)profit inferior to 5% of the balance
-
RE: balance limit to open operationsposted in Questions & Answers
@ajmd97fx
Sorry i should have done this configuration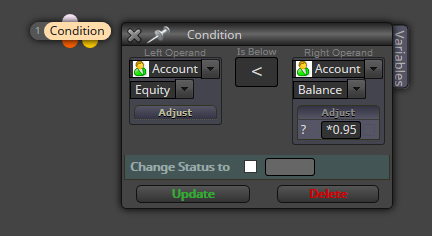
In yours you should reverse the "<" sign if you want the difference to be higher than X% of the Balance -
RE: Close order After "N" Candlesposted in Questions & Answers
@nazafks
Hi, you could make increase a variable by 1 every candle by the condition the position is losable, when the condition is above N -> close the trade. -
RE: balance limit to open operationsposted in Questions & Answers
@ajmd97fx
Hey i think I think this is what you need to do
-
RE: How can I rest parent trade please?posted in Questions & Answers
@khalids222
I am a bit lazy helping you building this strategy, even it is not so complicated.
However I can give you my advice : I don't think strategies only based on distance between one candle and another are worth it. Because,- no trend is supposed to last especially on the forex, in a way that if candle 0 > candle 1 the probability that the next candle is also above is close to 50%. 2 bull candles on H1 is an up trend on M5.
- And the probability of the price to reach a point is inversely proportionate to the distance between it and the start point, in a way that the probability of the price to go from 1.1500 to 1.1520 is 2 times lower than the probability to go from 1.500 to 1.510.
So the only utility(or one of the utilities) of fixing different levels of stops is to avoid the unluckiness of loosing an entire trade because of 1 pips, by spreading the targets into 2 or 3 stops to decrease the risk.
I would so add other indicators, more information to take in count in the strategy. -
RE: trailing stop % of loss optionposted in Questions & Answers
@xbuilder
Hum something like that then ?
https://fxdreema.com/shared/h2X08rYSd -
RE: trailing stop % of loss optionposted in Questions & Answers
@xbuilder
https://fxdreema.com/shared/EynkkElgd
Is that what you are looking for ?
The percentage is the "0.5" in block 18, for 50%. -
RE: trailing stop % of loss optionposted in Questions & Answers
@xbuilder
That's wierd, % of account loss, or % of specific positions loss ? -
RE: Wicks of candlesposted in Questions & Answers
@biztet
I think it's a bit too simple to spot true reversals, but it can be seen temporary resistance or support zones at least.
It is the strategy of Zackry after all so you should ask him. -
RE: Question for experienced backtestersposted in General Discussions
I actually don't manage to import properly bars from tickstory to my mt5 broker.
These are the settings in tickstory (with H1 period) :
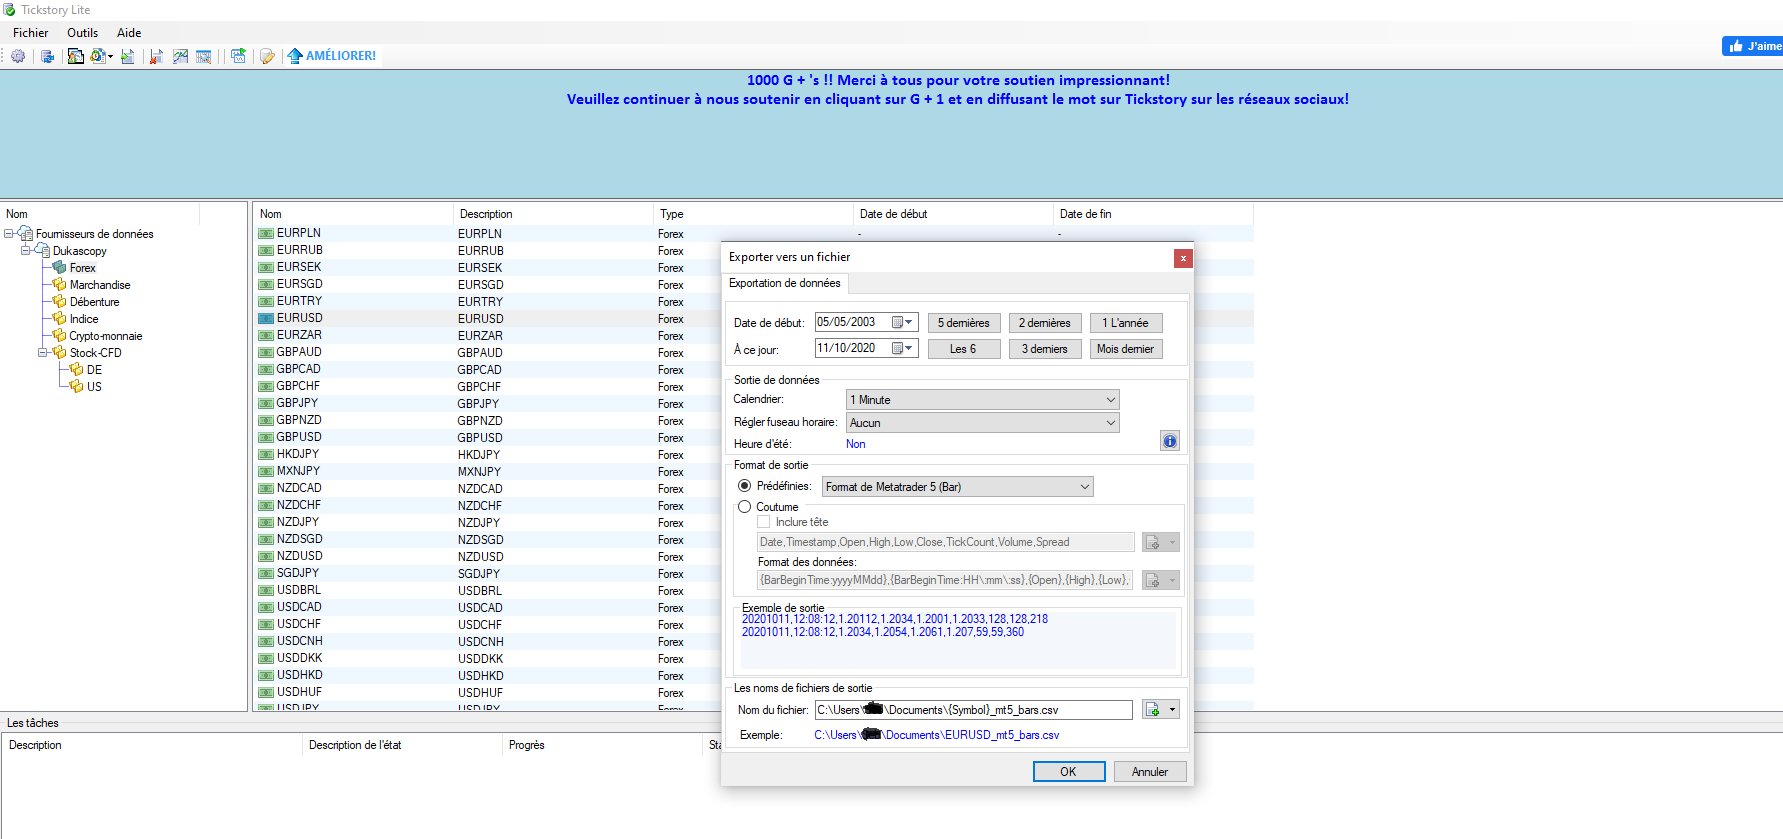
I then converted the .csv file to .json so it can be readen by the broker. I've placed the file in the terminal folder :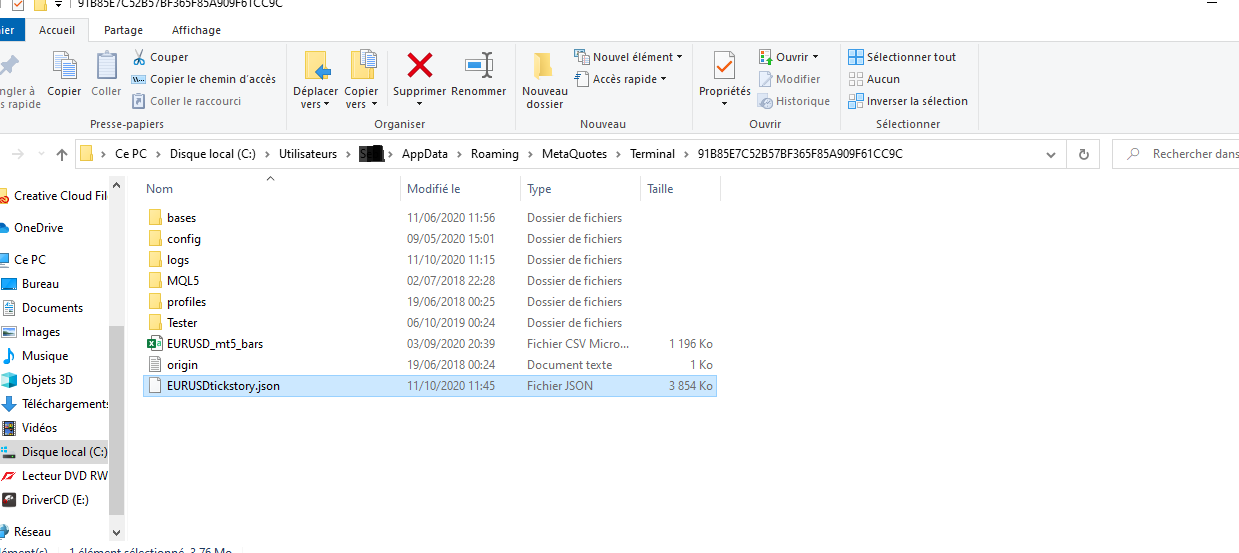
Launched my broker, and i can select the symbol appearing in the backtest window :
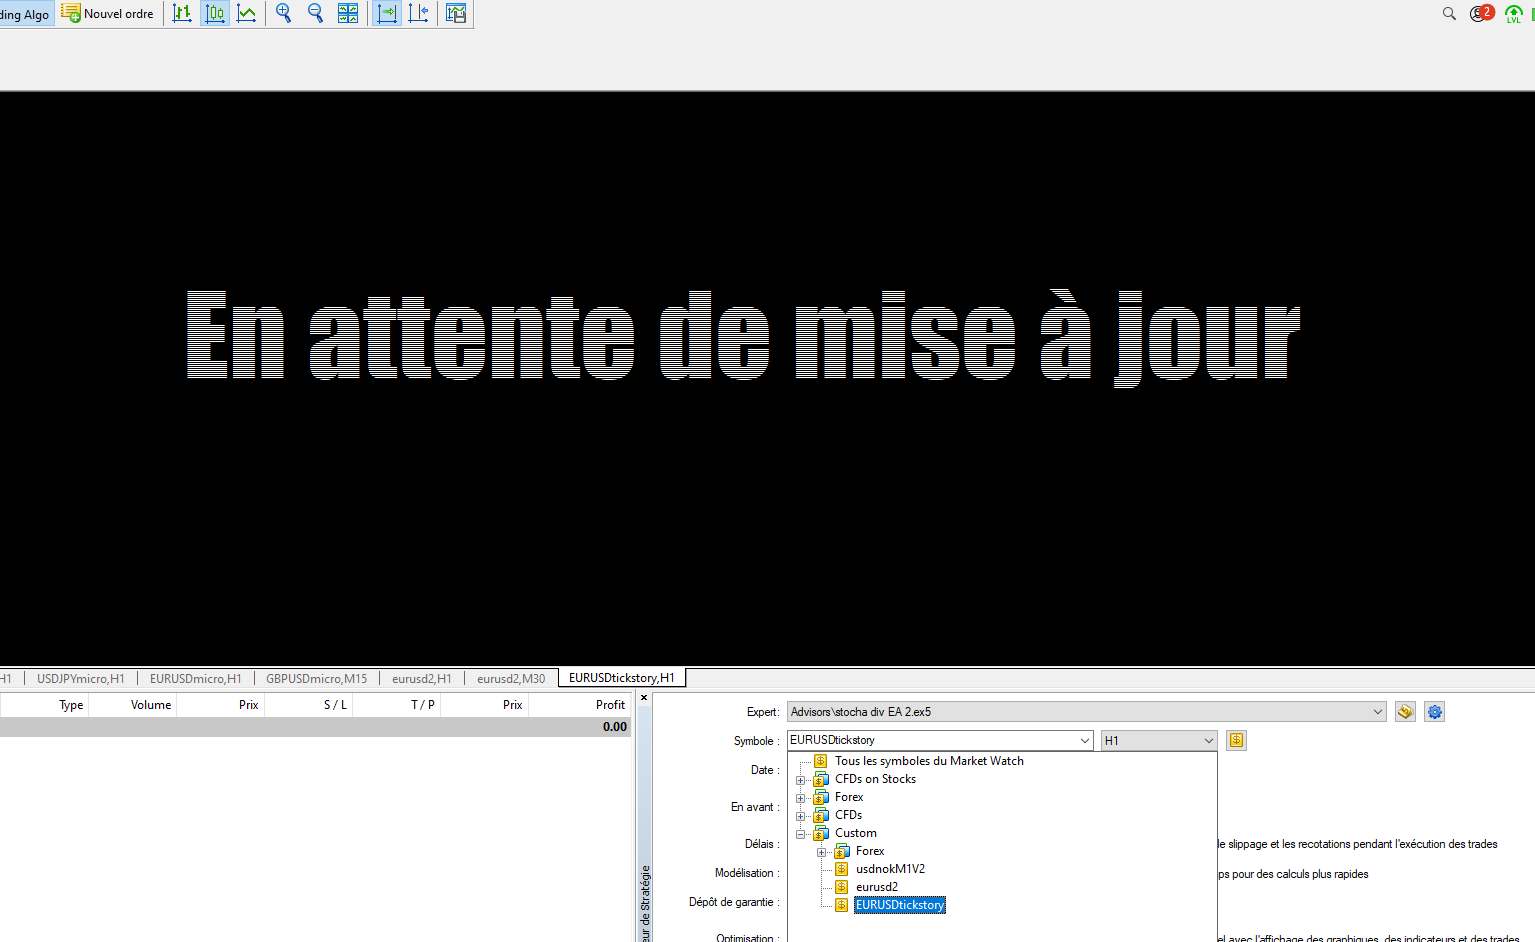
But it doesn't seem to find any data. I've tried to create a symbol by selecting this .json file but no graph is displaying, do you have an idea ?