#Indicators, What Are They?
The purpose of the Indicators is to give you visual information that might help you while trading. This information could look like lines, histograms, arrows or any other kind of visual information that you can see with your eyes and decide how to trade.
Indicators can also give that information to other programs - Expert Advisors or Scripts. But in this case the information is not visual, it's just numbers, because computer programs understand numbers.
Technically, all indicators work in the same way - they fill some arrays with numeric data. These arrays are called output buffers (or simply buffers). MetaTrader reads that information and prints it in on the chart.
#Find Your Custom Indicators
There is a term Custom Indicators - these are the indicators that you can write for MetaTrader. MetaTrader itself has a list of built-in indicators that you can use, but you can't modify. You can find your Custom Indicators in the following folders:
- For MetaTrader 4: %Data Folder%/MQL4/Indicators/
- For MetaTrader 5: %Data Folder%/MQL5/Indicators/
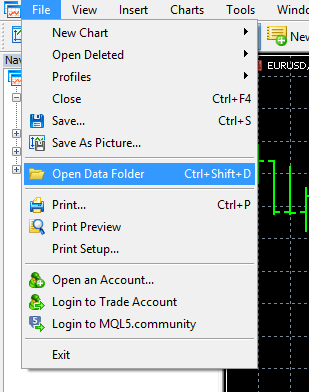
This is how to find your Data Folder
#How Indicators Communicate With Other Programs?
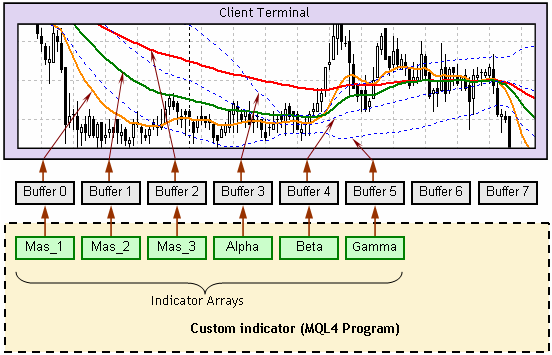
We already know that indicators put their numeric data into something called buffers, so other robots can read that data. A buffer is one-dimentional array filled with numeric data. The total number of elements in that array is the same as the number of candles on the chart, which means that for each candle there is one value. Each value of the buffer is mapped with one particular candle. Let's take the well known Moving Average for example:

Each candle has an ID number, or shift. The number of the newest candle is 0. The number of the previous candle is 1. Then we have 2, 3, 4 and so on. For each candle we have a numeric value:
- The value for candle 0 is 1.3667
- The value for candle 1 is 1.3658
- The value for candle 2 is 1.3641
- ...
Basically, this is our array of data, the output buffer. When these number are plotted on the chart by MetaTrader, we see a line.
We can have multiple buffers and each of them has its own number. Similar to the candles, the first buffer is 0, the second is 1, then 2 and so on.
Now let's say we want to get a value from an indicator in our Expert Advisor. We need to point to the indicator (by file name), to the output buffer (0, 1, 2, 3...) and to the candle ID (0, 1, 2, 3...).
Click here to find more information about the output buffers.
#How To Tell What Buffers Do Your Custom Indicator Have?
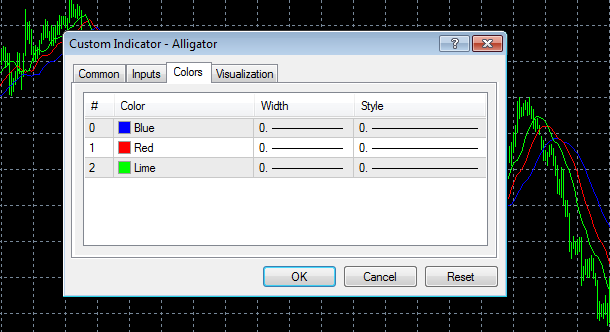
When you add a custom indicator to a chart, you are able to see its parameters. Go to the Colors tab and you will see something like this:
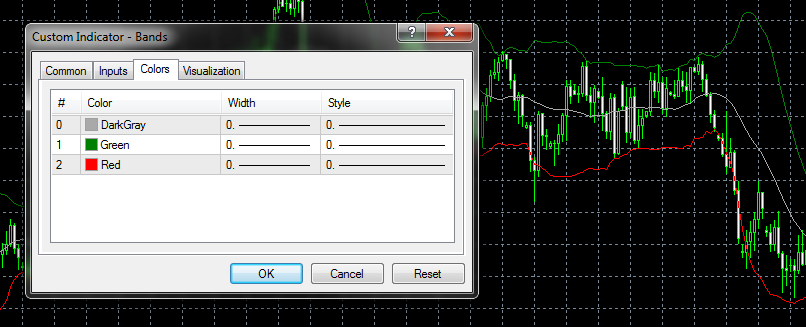
Obviously, there are 3 output buffers and you can even see their numbers - 0, 1 and 2. You can also guess what each of them represent:
- Buffer 0 is for the center line
- Buffer 1 is for the upper line
- buffer 2 is for the lower line
#Arrows In Indicators (Interrupted Signals)
Some indicators don't print continuous lines. You have probably seen indicators with arrows placed here and there. How do they do that?
In the indicator's code there are instructions of how MetaTrader should draw the data from the buffers on the chart. Whether that data will look like a line, or like a histogram, or some kind of arrows or dots. Here are the possible drawing styles:
But we already know that each output buffer has as many elements (values) as many candles exist on the chart, and this is always true. So how do we show something only on certain candles? It's pretty simple, there is a special value that we can put in the buffer and when MetaTrader sees that value, it doesn't show anything on the chart for that candle. This value it called EMPTY_VALUE. This is a predefined constant and its actual value is the biggest possible integer value:
- 32 bit (MetaTrader 4): EMPTY_VALUE is equal to 2,147,483,647
- 64 bit (MetaTrader 5): EMPTY_VALUE is equal to 9,223,372,036,854,775,807
You can now imagine that if the output buffer is filled with EMPTY_VALUE all the way, you will not see anything on the chart.
Hint 1: In fxDreema, the Condition block would not pass if one of its operands equals to EMPTY_VALUE. This is because EMPTY_VALUE should be treated as something that does not exists, its name contains the word "empty" after all.
Hint 2: If you expect signals from an indicator who draws arrows and you don't have any, try to set Candle ID parameter to something bigger than 0. These indicators are normally giving you signals on an older candle, not in the current one. Try with Candle ID = 1.
#Arrows And Lines On The Chart, But Nothing In The Buffers?
Yes, it's possible. Some indicators are drawing their objects directly on the chart. This is mostly true for indicators who draw trend-lines or arrows. In this case you can't use the output buffers to extract the values, but you can get the information from the objects. Although this is often not an easy task.
Also note that if this is the case, if the indicator that you are using is drawing only objects and in your Expert Advisor you managed to wirk with them somehow, the strategy might not work when you do Optimization, because of some limitations in MetaTrader.
Click Here For More Information About Chart Objects
#Check Out The Buffer Contents
When you first try a new custom indicator, you probably don't have a clue what's inside its buffers and how to use them in your strategies. But you can easily check them with the Trace block. Take a look at the following example (this is not a screenshot):
.When backtested, the result looks like this:
What you want to see is various values. If you only see one value that is the same for all candles, then you can't use this buffer with this configuration.
#When Do Indicators Show On The Chart Automatically?
You will notice that all indicators automatically appear after a back-test, but not in forward-test. Isn't that strange?
When an Expert Advisor or a Script is using an indicator in its code, that indicator is loaded in background and you don't see it on the chart, ever. That's why if you want to see the indicator, you need to manually add it on the chart. But when you do this, you are actually creating another instance of the indicator and you still don't see the one that is working in the background. You may even try to modify its input parameters, this will not change the parameters of the indicator that is loaded by the robot in background.
#Not Enough Information?
For more detailed information, go and read this article.
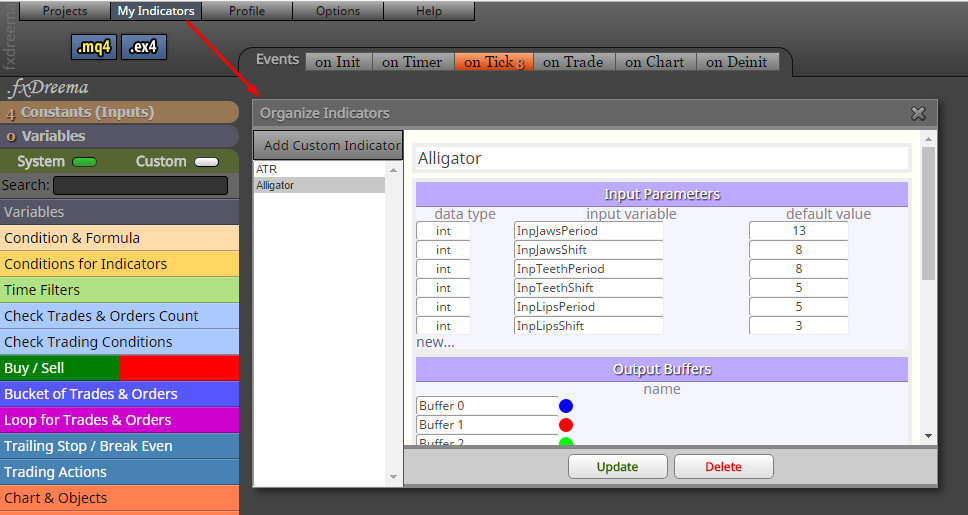
#How To Use Custom Indicators In FxDreema?
In fxDreema you can add custom indicators into the database so you can then use them easily in your projects. First, go to My Indicators. To add a new indicator, you need its source code file, which has extension .mq4 or .mq5. You can also manually fill all the necessary information if you don't have the source code.
In fact, the process of adding new indicator from a source code file does not involve uploading the whole file to the server. All the necessary information is read locally by the browser and then only this is sent to the server. For a custom indicator you only need the following information:
- Indicator Name - This MUST be the same as the filename of your custom indicator (without the extension). If the file name is "Custom ATR.mq5", then write "Custom ATR".
- Input Parameters - Their count and order MUST be correct, otherwise the custom indicator won't be load successfully. The names should also be the same, but this is not mandatory. Their data types should be at least similar.
- Output Buffers - You can give them any name that you will better understand.
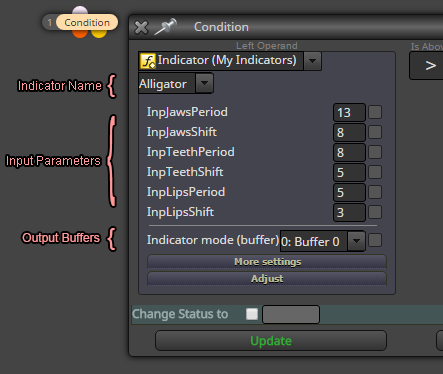
Now you can use your custom indicator in the blocks of fxDreema, for example in Condition.
#How To Manually Add A Custom Indicator?
You have 2 options - to get the information from the source code or from MetaTrader.
Option 1: Get the information from the source code
You can open the source code file and get the information from there. All the necessary information is located somewhere on the top. This is part of a custom indicator:
//+------------------------------------------------------------------+
//|                                                    Alligator.mq5 |
//|                   Copyright 2009-2017, MetaQuotes Software Corp. |
//|                                              http://www.mql5.com |
//+------------------------------------------------------------------+
#property copyright "2009-2017, MetaQuotes Software Corp."
#property link      "http://www.mql5.com"

//---- indicator settings
#property indicator_chart_window
#property indicator_buffers 3
#property indicator_plots   3
#property indicator_type1   DRAW_LINE
#property indicator_type2   DRAW_LINE
#property indicator_type3   DRAW_LINE
#property indicator_color1  Blue
#property indicator_color2  Red
#property indicator_color3  Lime
#property indicator_width1  1
#property indicator_width2  1
#property indicator_width3  1
#property indicator_label1  "Jaws"
#property indicator_label2  "Teeth"
#property indicator_label3  "Lips"
//---- input parameters
input int                InpJawsPeriod=13;               // Jaws period
input int                InpJawsShift=8;                 // Jaws shift
input int                InpTeethPeriod=8;               // Teeth period
input int                InpTeethShift=5;                // Teeth shift
input int                InpLipsPeriod=5;                // Lips period
input int                InpLipsShift=3;                 // Lips shift
input ENUM_MA_METHOD     InpMAMethod=MODE_SMMA;          // Moving average method
input ENUM_APPLIED_PRICE InpAppliedPrice=PRICE_MEDIAN;   // Applied price
//---- indicator buffers
double ExtJaws[];
double ExtTeeth[];
double ExtLips[];
//---- handles for moving averages
int    ExtJawsHandle;
int    ExtTeethHandle;
int    ExtLipsHandle;
//--- bars minimum for calculation
int    ExtBarsMinimum;
You can see where the input parameters are defined:
input int                InpJawsPeriod=13;               // Jaws period
input int                InpJawsShift=8;                 // Jaws shift
input int                InpTeethPeriod=8;               // Teeth period
input int                InpTeethShift=5;                // Teeth shift
input int                InpLipsPeriod=5;                // Lips period
input int                InpLipsShift=3;                 // Lips shift
input ENUM_MA_METHOD     InpMAMethod=MODE_SMMA;          // Moving average method
input ENUM_APPLIED_PRICE InpAppliedPrice=PRICE_MEDIAN;   // Applied price
The keyword input is what turns these global variables into input parameters. The second word is the data type (int, ENUM_MA_METHOD, ENUM_APPLIED_PRICE). Then we see the name of the parameter (InpJawsPeriod, InpJawsShift...). After that we have the default values (13, 8...). At the end we have the description for each parameter.
This is where we can see the number of output buffers and we obviously have 3 buffers:
#property indicator_buffers 3
#property indicator_plots 3
Option 2: Get the information from MetaTrader
Open the parameters of your indicator. The Input Parameters are listed under the Inputs tab and the Output Buffers are under the Colors tab:
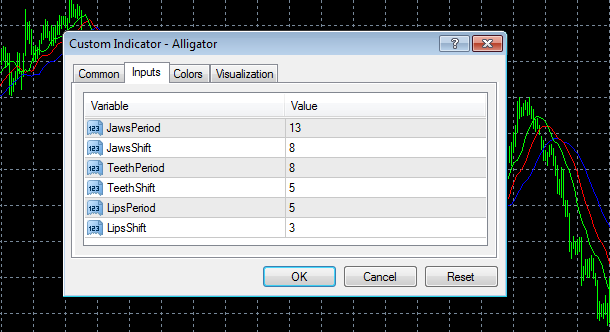
The data type of the each input parameters is presented as an icon. Here is what the icon means:
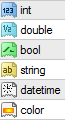
- int - Numeric type, whole integer numbers, for example 3
- double - Numeric type, floating point numbers, for example 3.654
- bool - Boolean type, either true or false
- string - A text, for example "Hello, World"
- datetime - Numeric type, it is in fact an integer value, but it is accepted to use this data type for time parameters
- color - Numeric type, also an integer value, but designed to describe colors